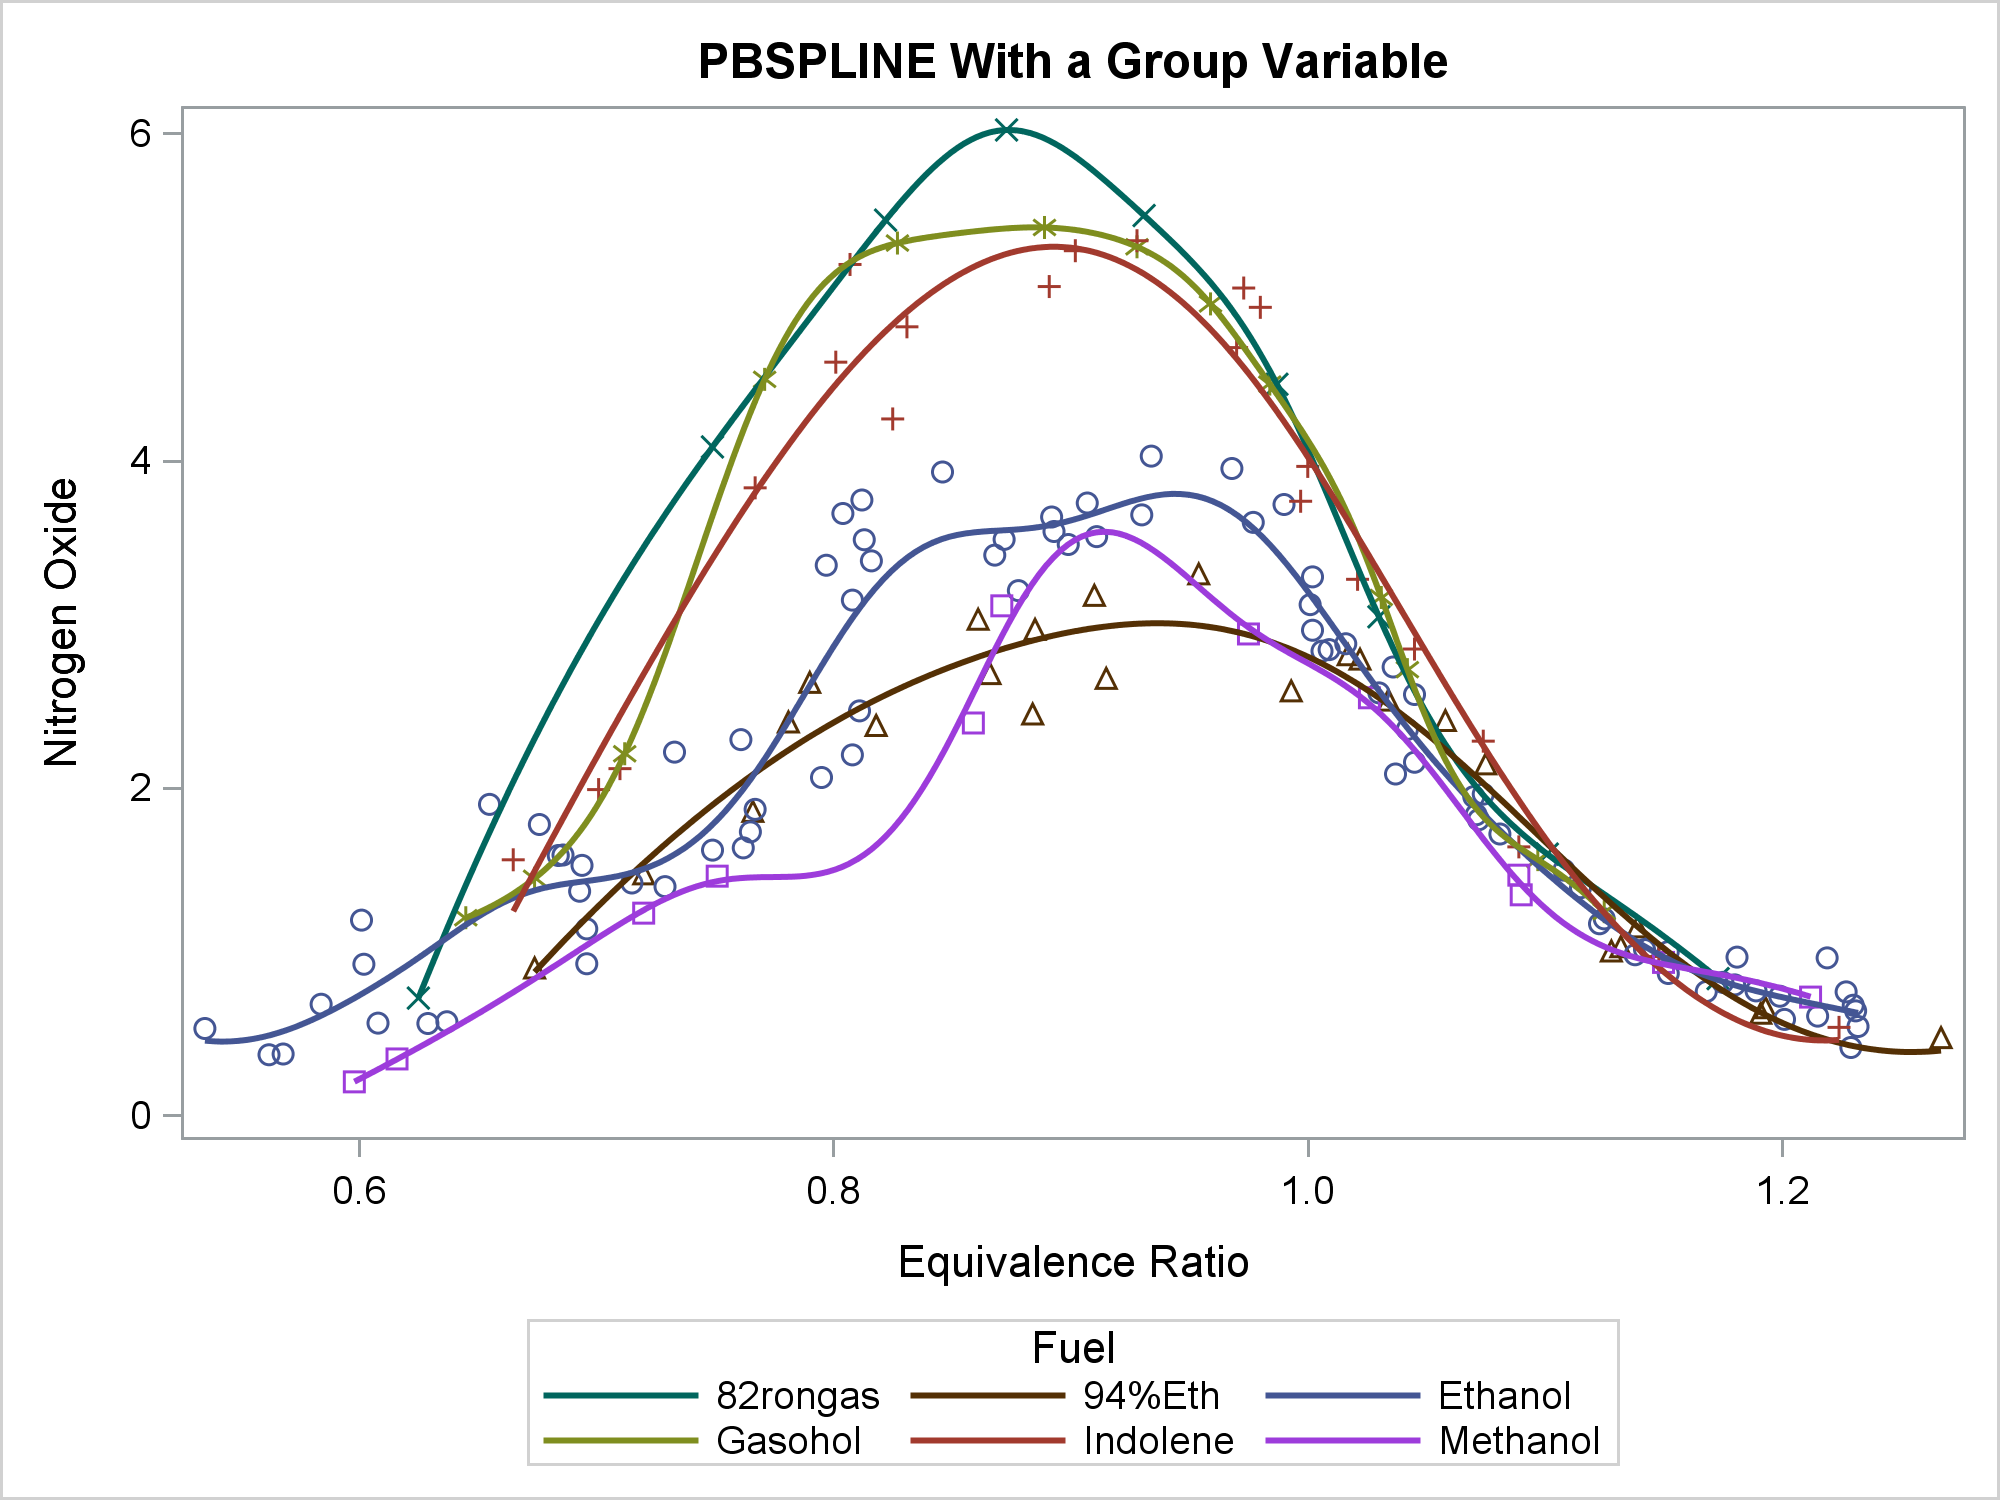
You can use penalized B-splines display a smooth curve through a set of data. The PBSPLINE statement fits spline models, displays the fit function(s), and optionally displays the data values.
Tag: PBSpline
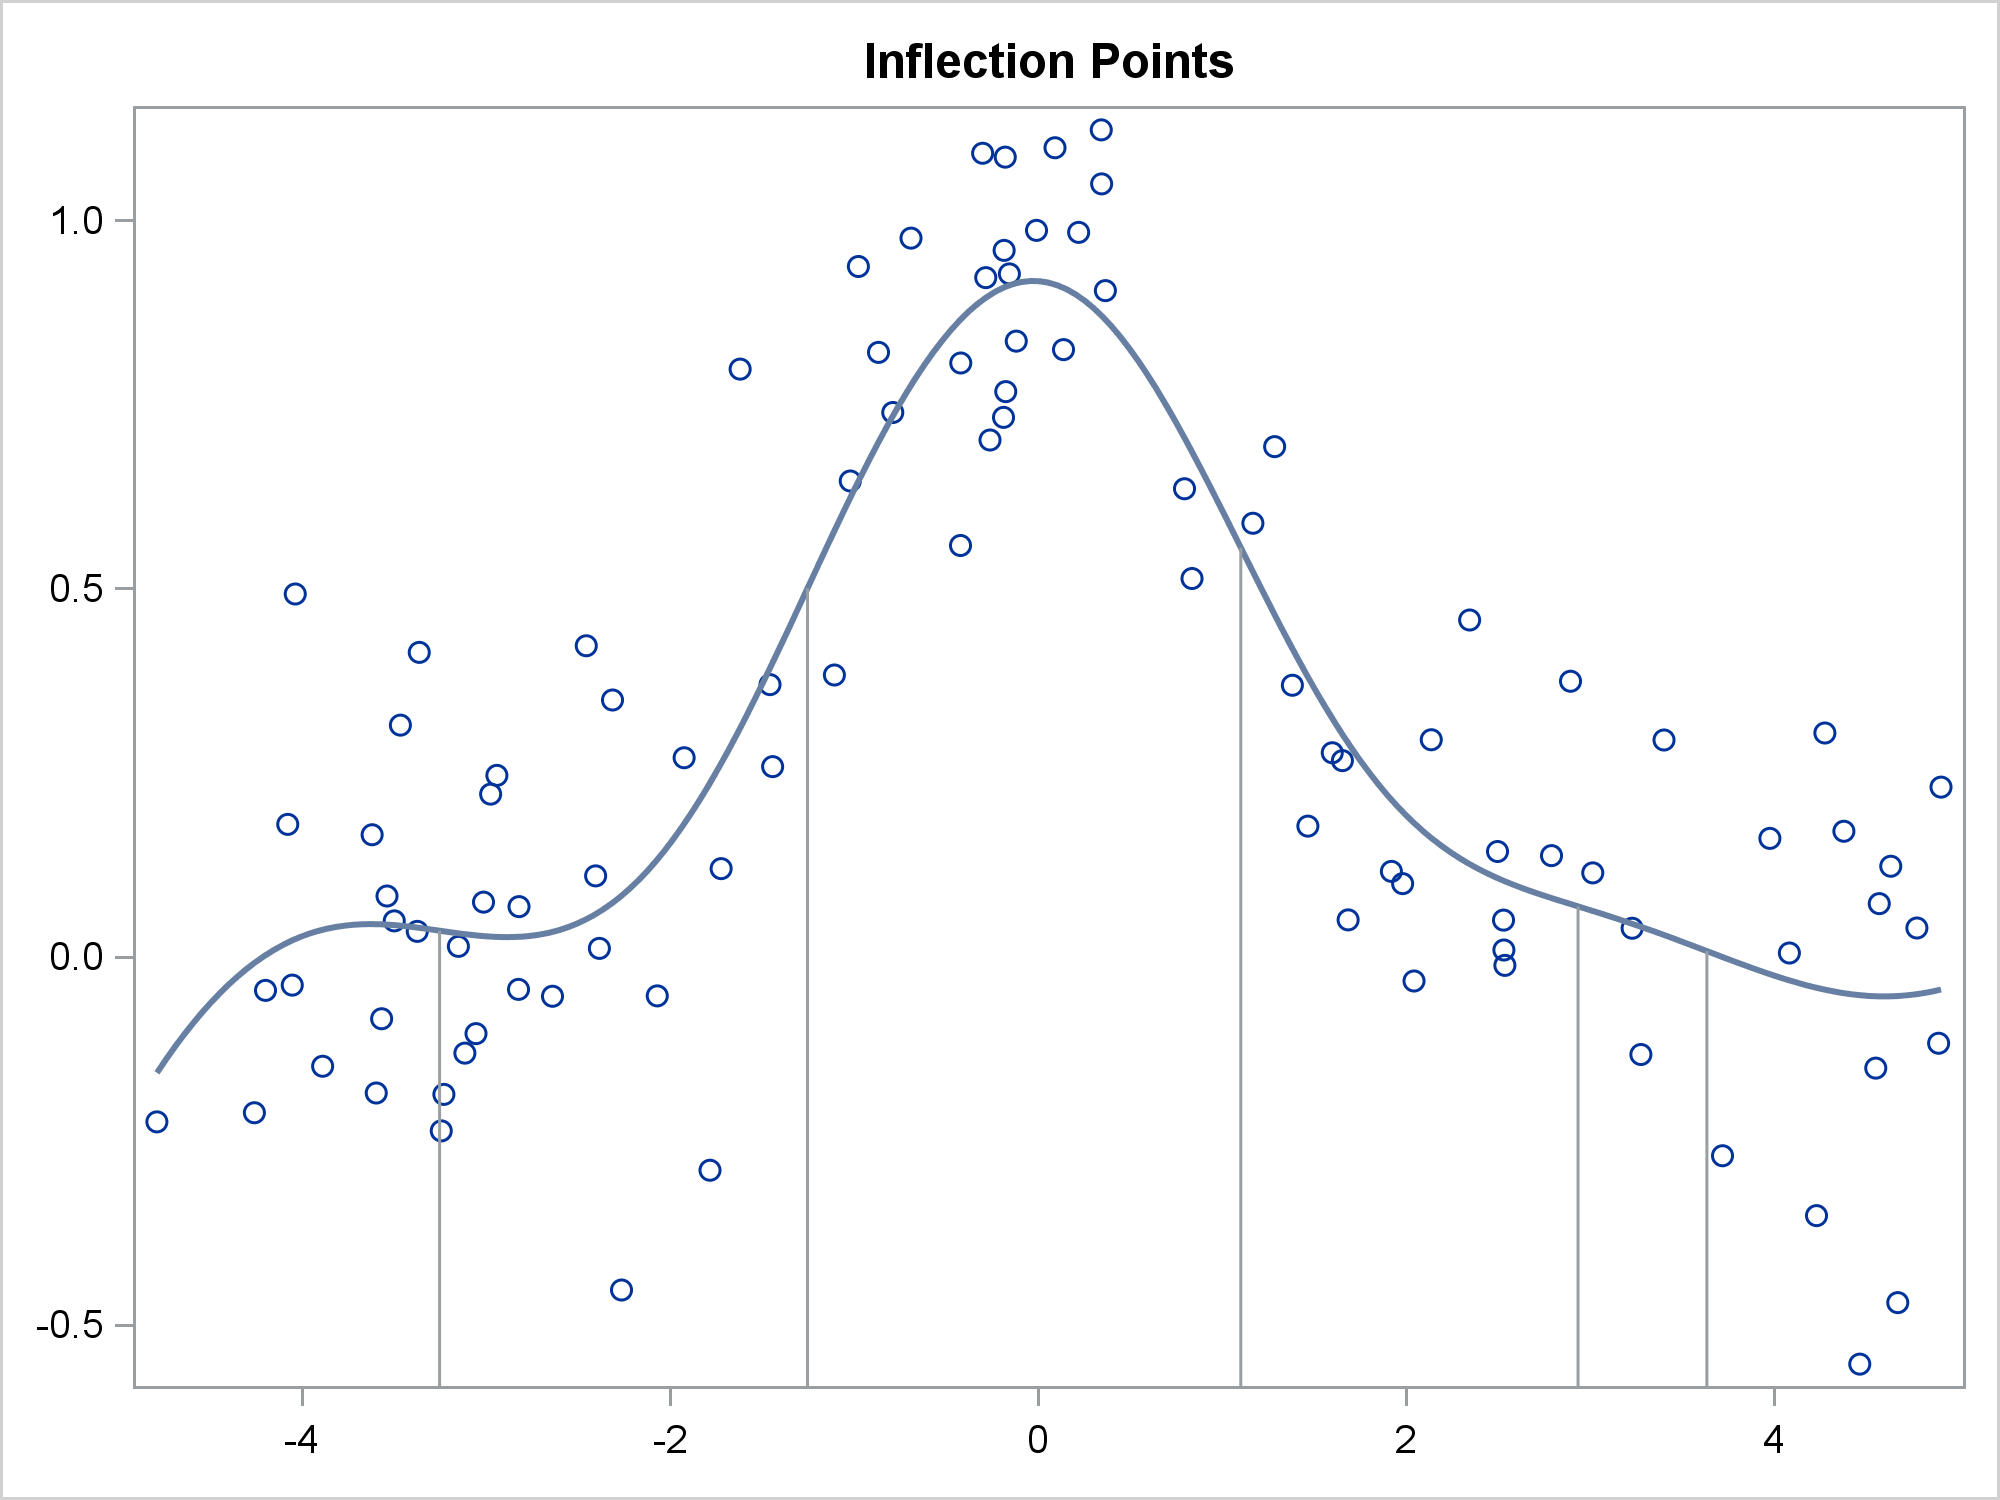
This post shows you how to run PROC SGPLOT, create smooth curves by using penalized B-splines, use ODS OUTPUT to create an output data set from PROC SGPLOT, and process it to display drop lines.
Often, the topic of an article is motivated by a question from a user. A satisfactory resolution of the situation is usually a good indication of a topic that may be of interest to other users. On such question was posed to me by a user this weekend. He wanted to display fit
I decided this year to get serious about my running. I started recording my distance for every run. I made a SAS data set and generated simple reports. After a few weeks, I set a goal of averaging one marathon a week (3.8 miles per day, 26.2 miles per week,