
Sometimes it is useful to know the extreme values in data. You might need to know the Top 5 or the Top 10 smallest data values. Or, the Top 5 or Top 10 largest data values. There are many ways to do this in SAS, but this article shows examples
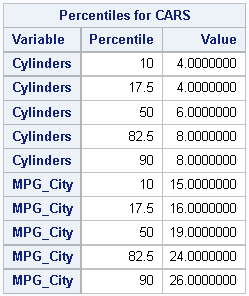
How can you estimate percentiles in SAS Viya? This article shows how to call the percentile action from PROC CAS to estimate percentiles of variables in a CAS data table. Percentiles and quantiles are essentially the same (the pth quantile is the 100*pth percentile for p in [0, 1]), so
Last year, I wrote almost 100 posts for The DO Loop blog. My most popular articles were about data visualization, statistics and data analysis, and simulation and bootstrapping. If you missed any of these gems when they were first published, here are some of the most popular articles from 2021: