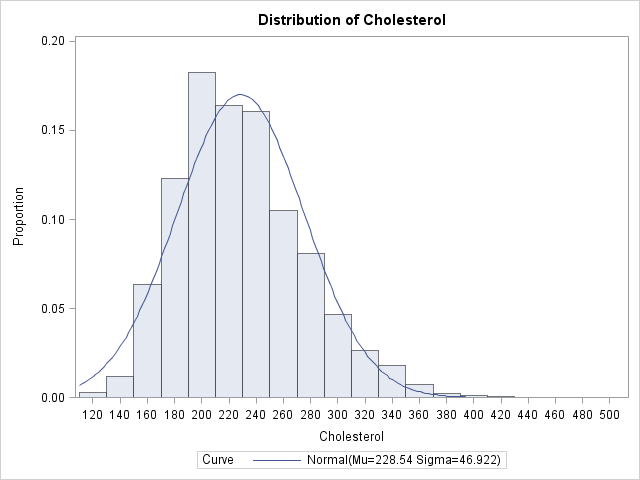
The area under a density estimate curve: Parametric estimates

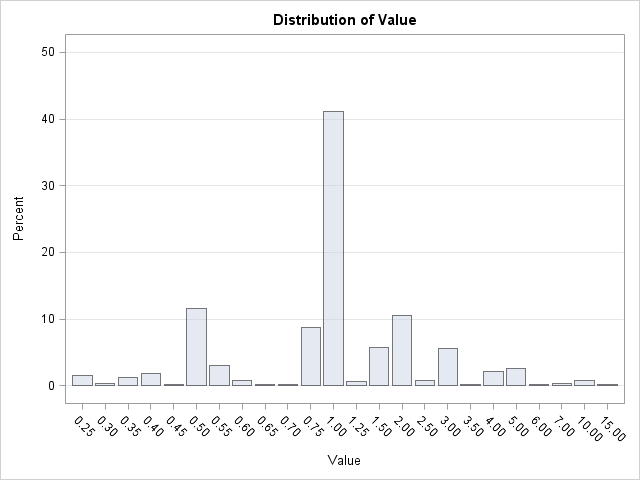
The area under a density estimate curve gives information about the probability that an event occurs. The simplest density estimate is a histogram, and last week I described a few ways to compute empirical estimates of probabilities from histograms and from the data themselves, including how to construct the empirical