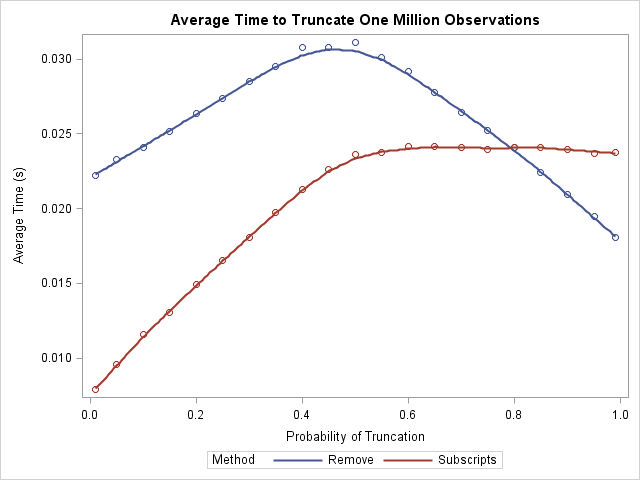
Remove or keep: Which is faster?

In a recent article on efficient simulation from a truncated distribution, I wrote some SAS/IML code that used the LOC function to find and exclude observations that satisfy some criterion. Some readers came up with an alternative algorithm that uses the REMOVE function instead of subscripts. I remarked in a