Tag: Data Analysis

Learn SAS
Rick Wicklin 0
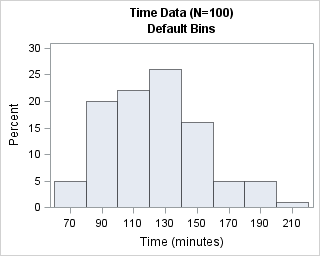
Choosing bins for histograms in SAS

When you create a histogram with statistical software, the software uses the data (including the sample size) to automatically choose the width and location of the histogram bins. The resulting histogram is an attempt to balance statistical considerations, such as estimating the underlying density, and "human considerations," such as choosing

Rick Wicklin 0
Creating heat maps in SAS/IML

In a previous blog post, I showed how to use the graph template language (GTL) in SAS to create heat maps with a continuous color ramp. SAS/IML 13.1 includes the HEATMAPCONT subroutine, which makes it easy to create heat maps with continuous color ramps from SAS/IML matrices. Typical usage includes

1 119 120 121 122 123 170