An exploratory technique for visualizing the distributions of 100 variables

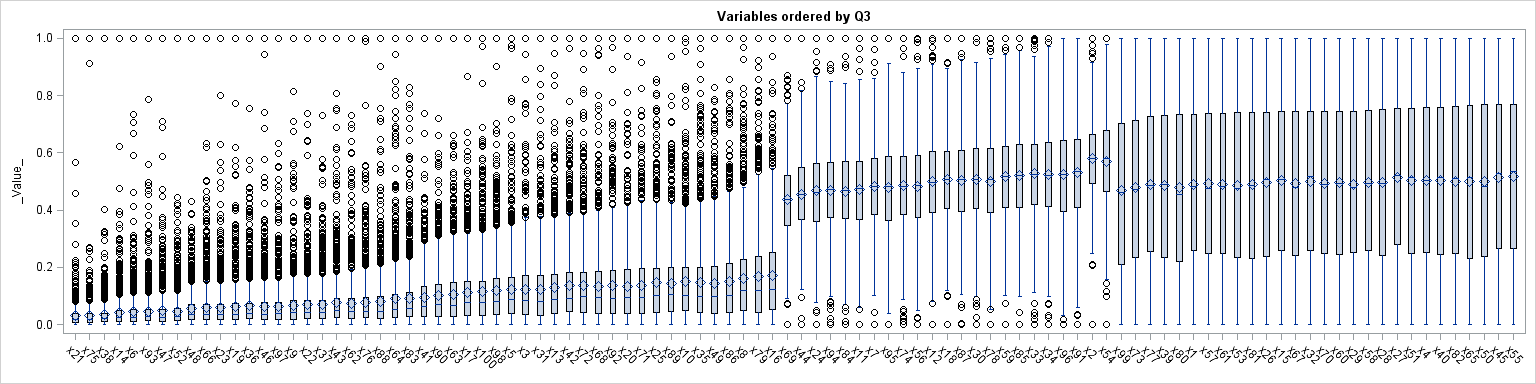
In a previous blog post I showed how to order a set of variables by a statistic. After reshaping data, you can create a graph that contains box plots for many variables. Ordering the variables by some statistic (mean, median, variance,...) helps to differentiate and distinguish the variables. You can