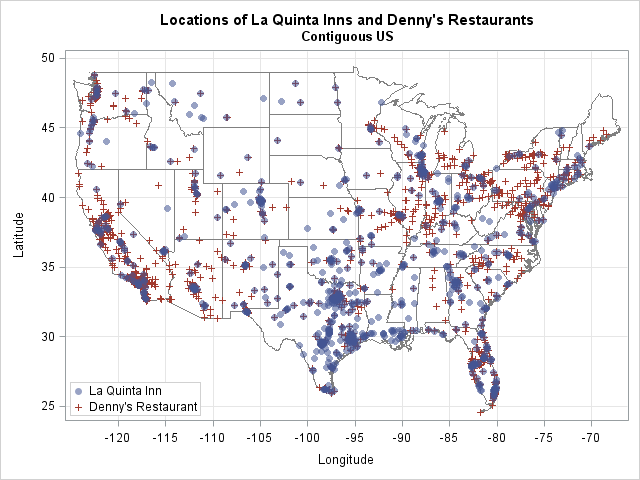
Tag: Data Analysis

Rick Wicklin 0
Let PROC FREQ create graphs of your two-way tables

The recent releases of SAS 9.4 have featured major enhancements to the ODS statistical graphics procedures such as PROC SGPLOT. In fact, PROC SGPLOT (and the underlying Graph Template Language (GTL)) are so versatile and powerful that you might forget to consider whether you can create a graph automatically by

Rick Wicklin 0
Create an ogive in SAS

My son is taking an AP Statistics course in high school this year. AP Statistics is one of the fastest-growing AP courses, so I welcome the chance to see topics and techniques in the course. Last week I was pleased to see that they teach data exploration techniques, such as

1 100 101 102 103 104 171