Graph a step function in SAS

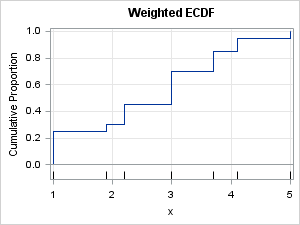
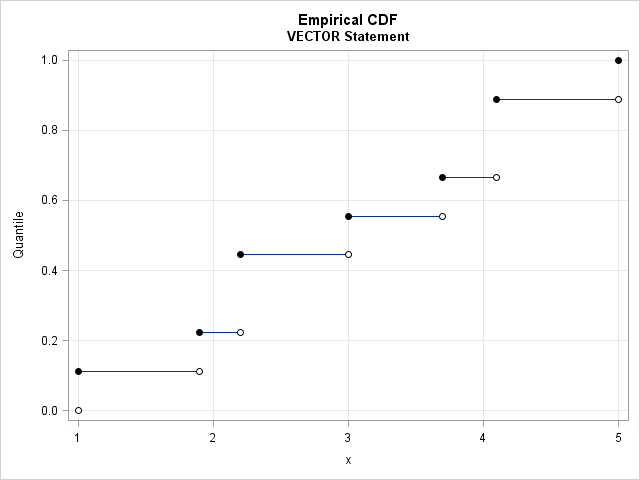
Last week I wrote about how to compute sample quantiles and weighted quantiles in SAS. As part of that article, I needed to draw some step functions. Recall that a step function is a piecewise constant function that jumps by a certain amount at a finite number of points. Graph