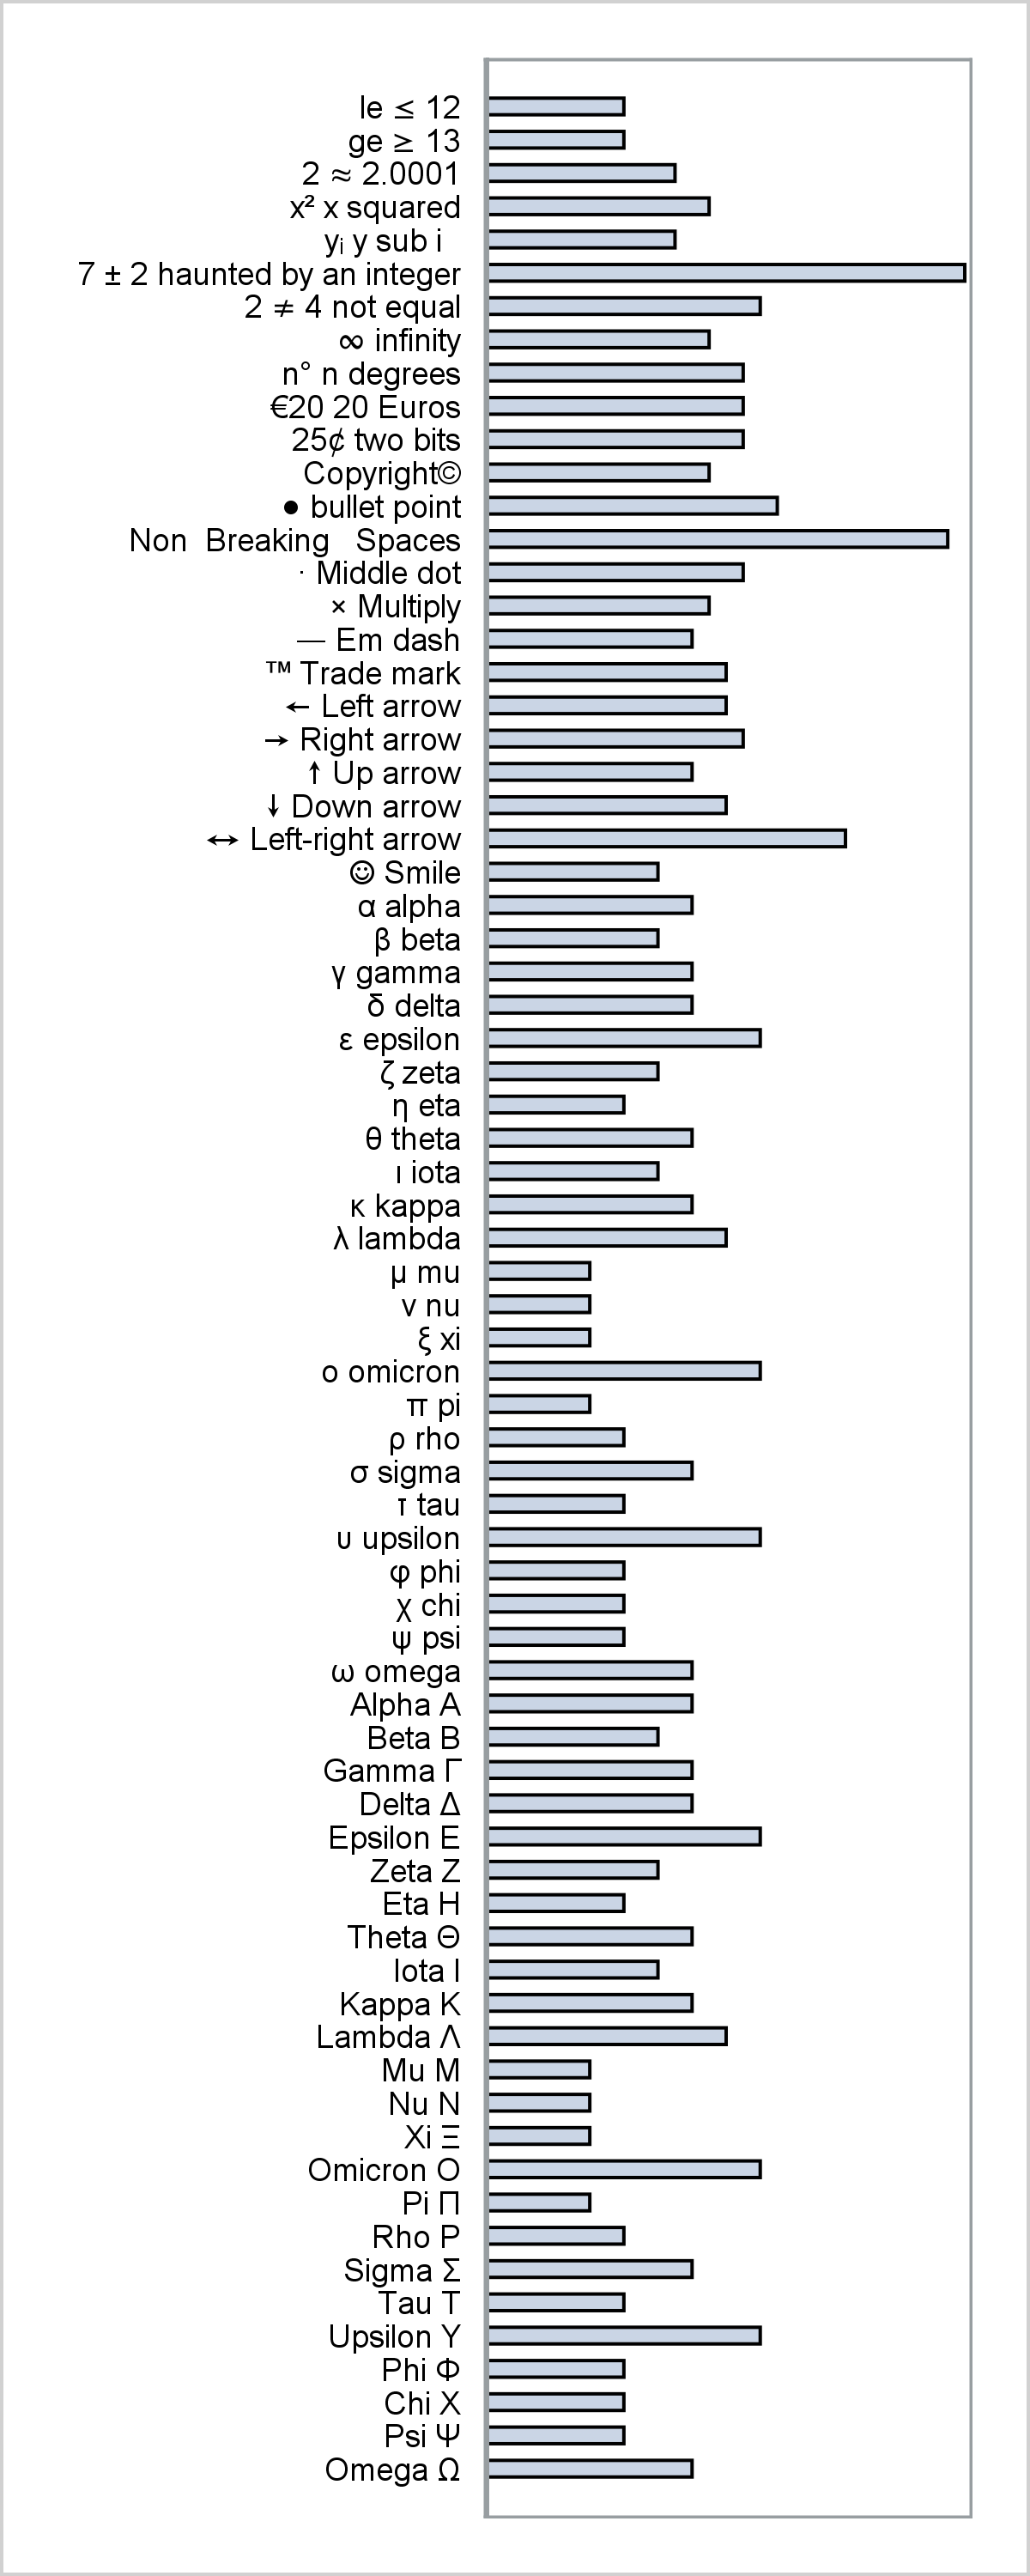
This post provides a general macro that enables you to easily display special characters (Unicode) in axis table columns.
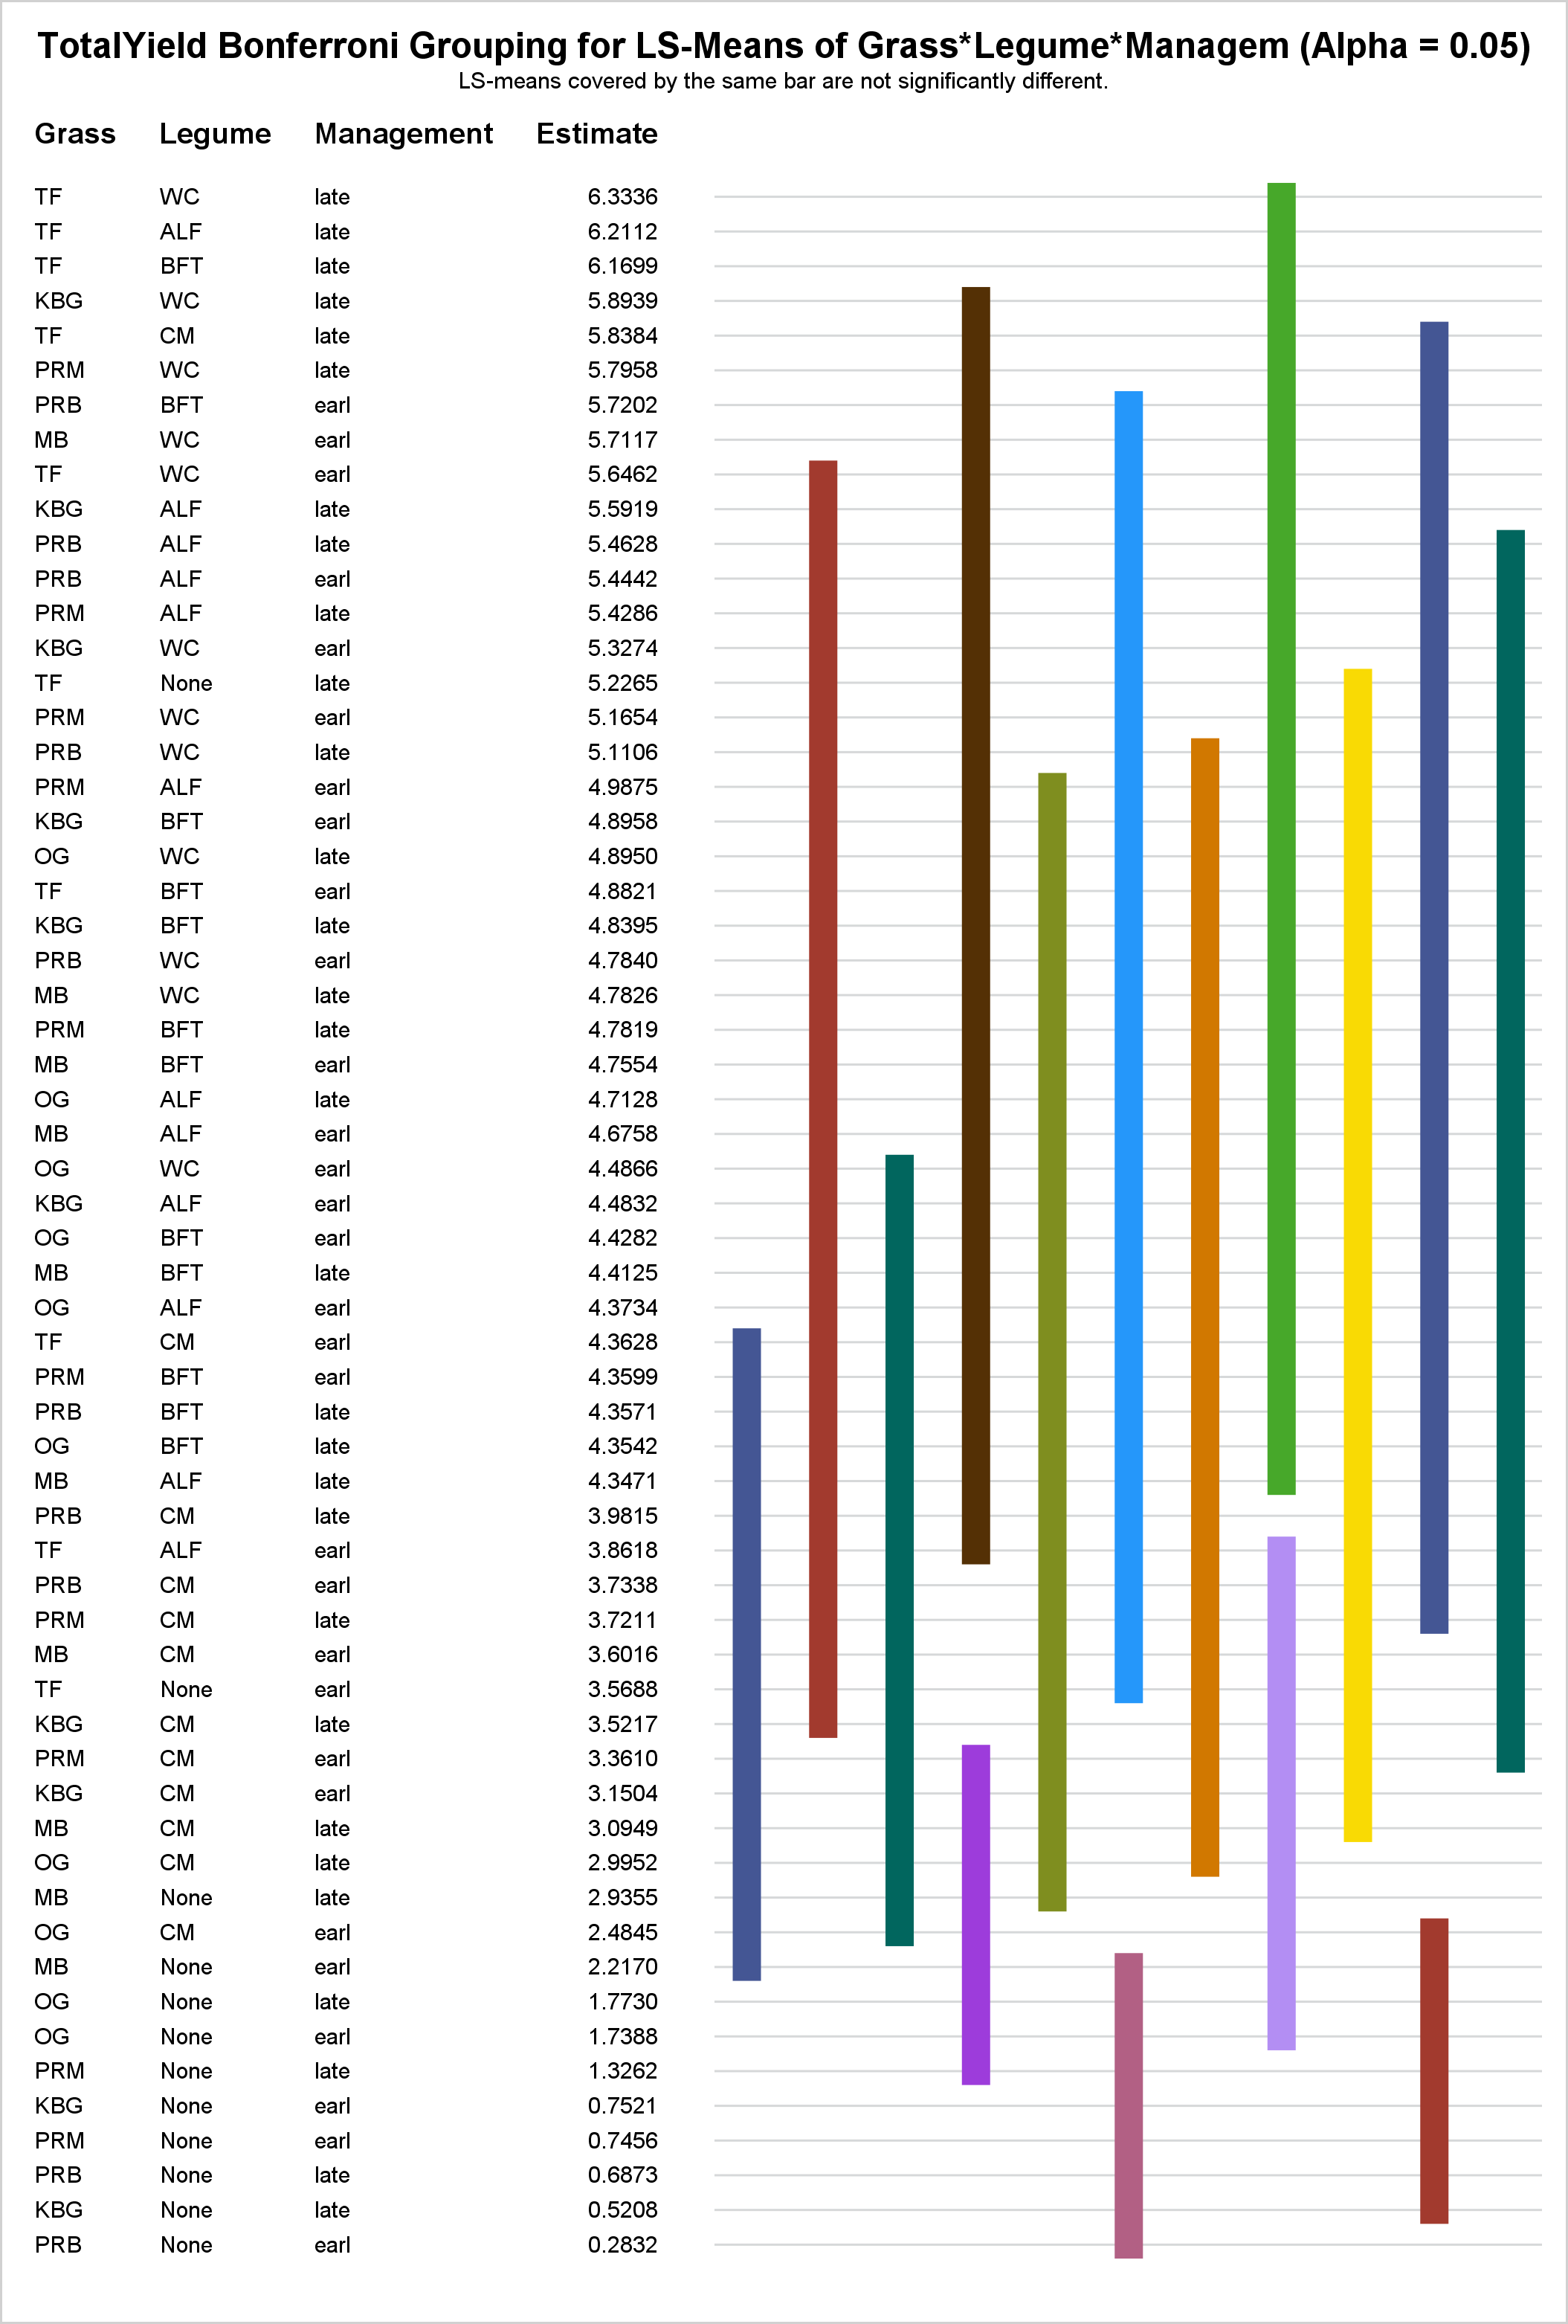
In PROC GLM and most other procedures that compute LS-means, mean comparisons are now displayed graphically. This makes comparisons between a large number of groups easier to interpret.
This post shows a variety of techniques including how to use PROC TEMPLATE and the SOURCE statement, PROC SGPLOT with multiple Y-axis tables, create comparable axes in two side-by-side graphs, create a broken axis, write and use a table template that wraps text, and find and display examples of certain statements in graph templates and fonts in style templates.