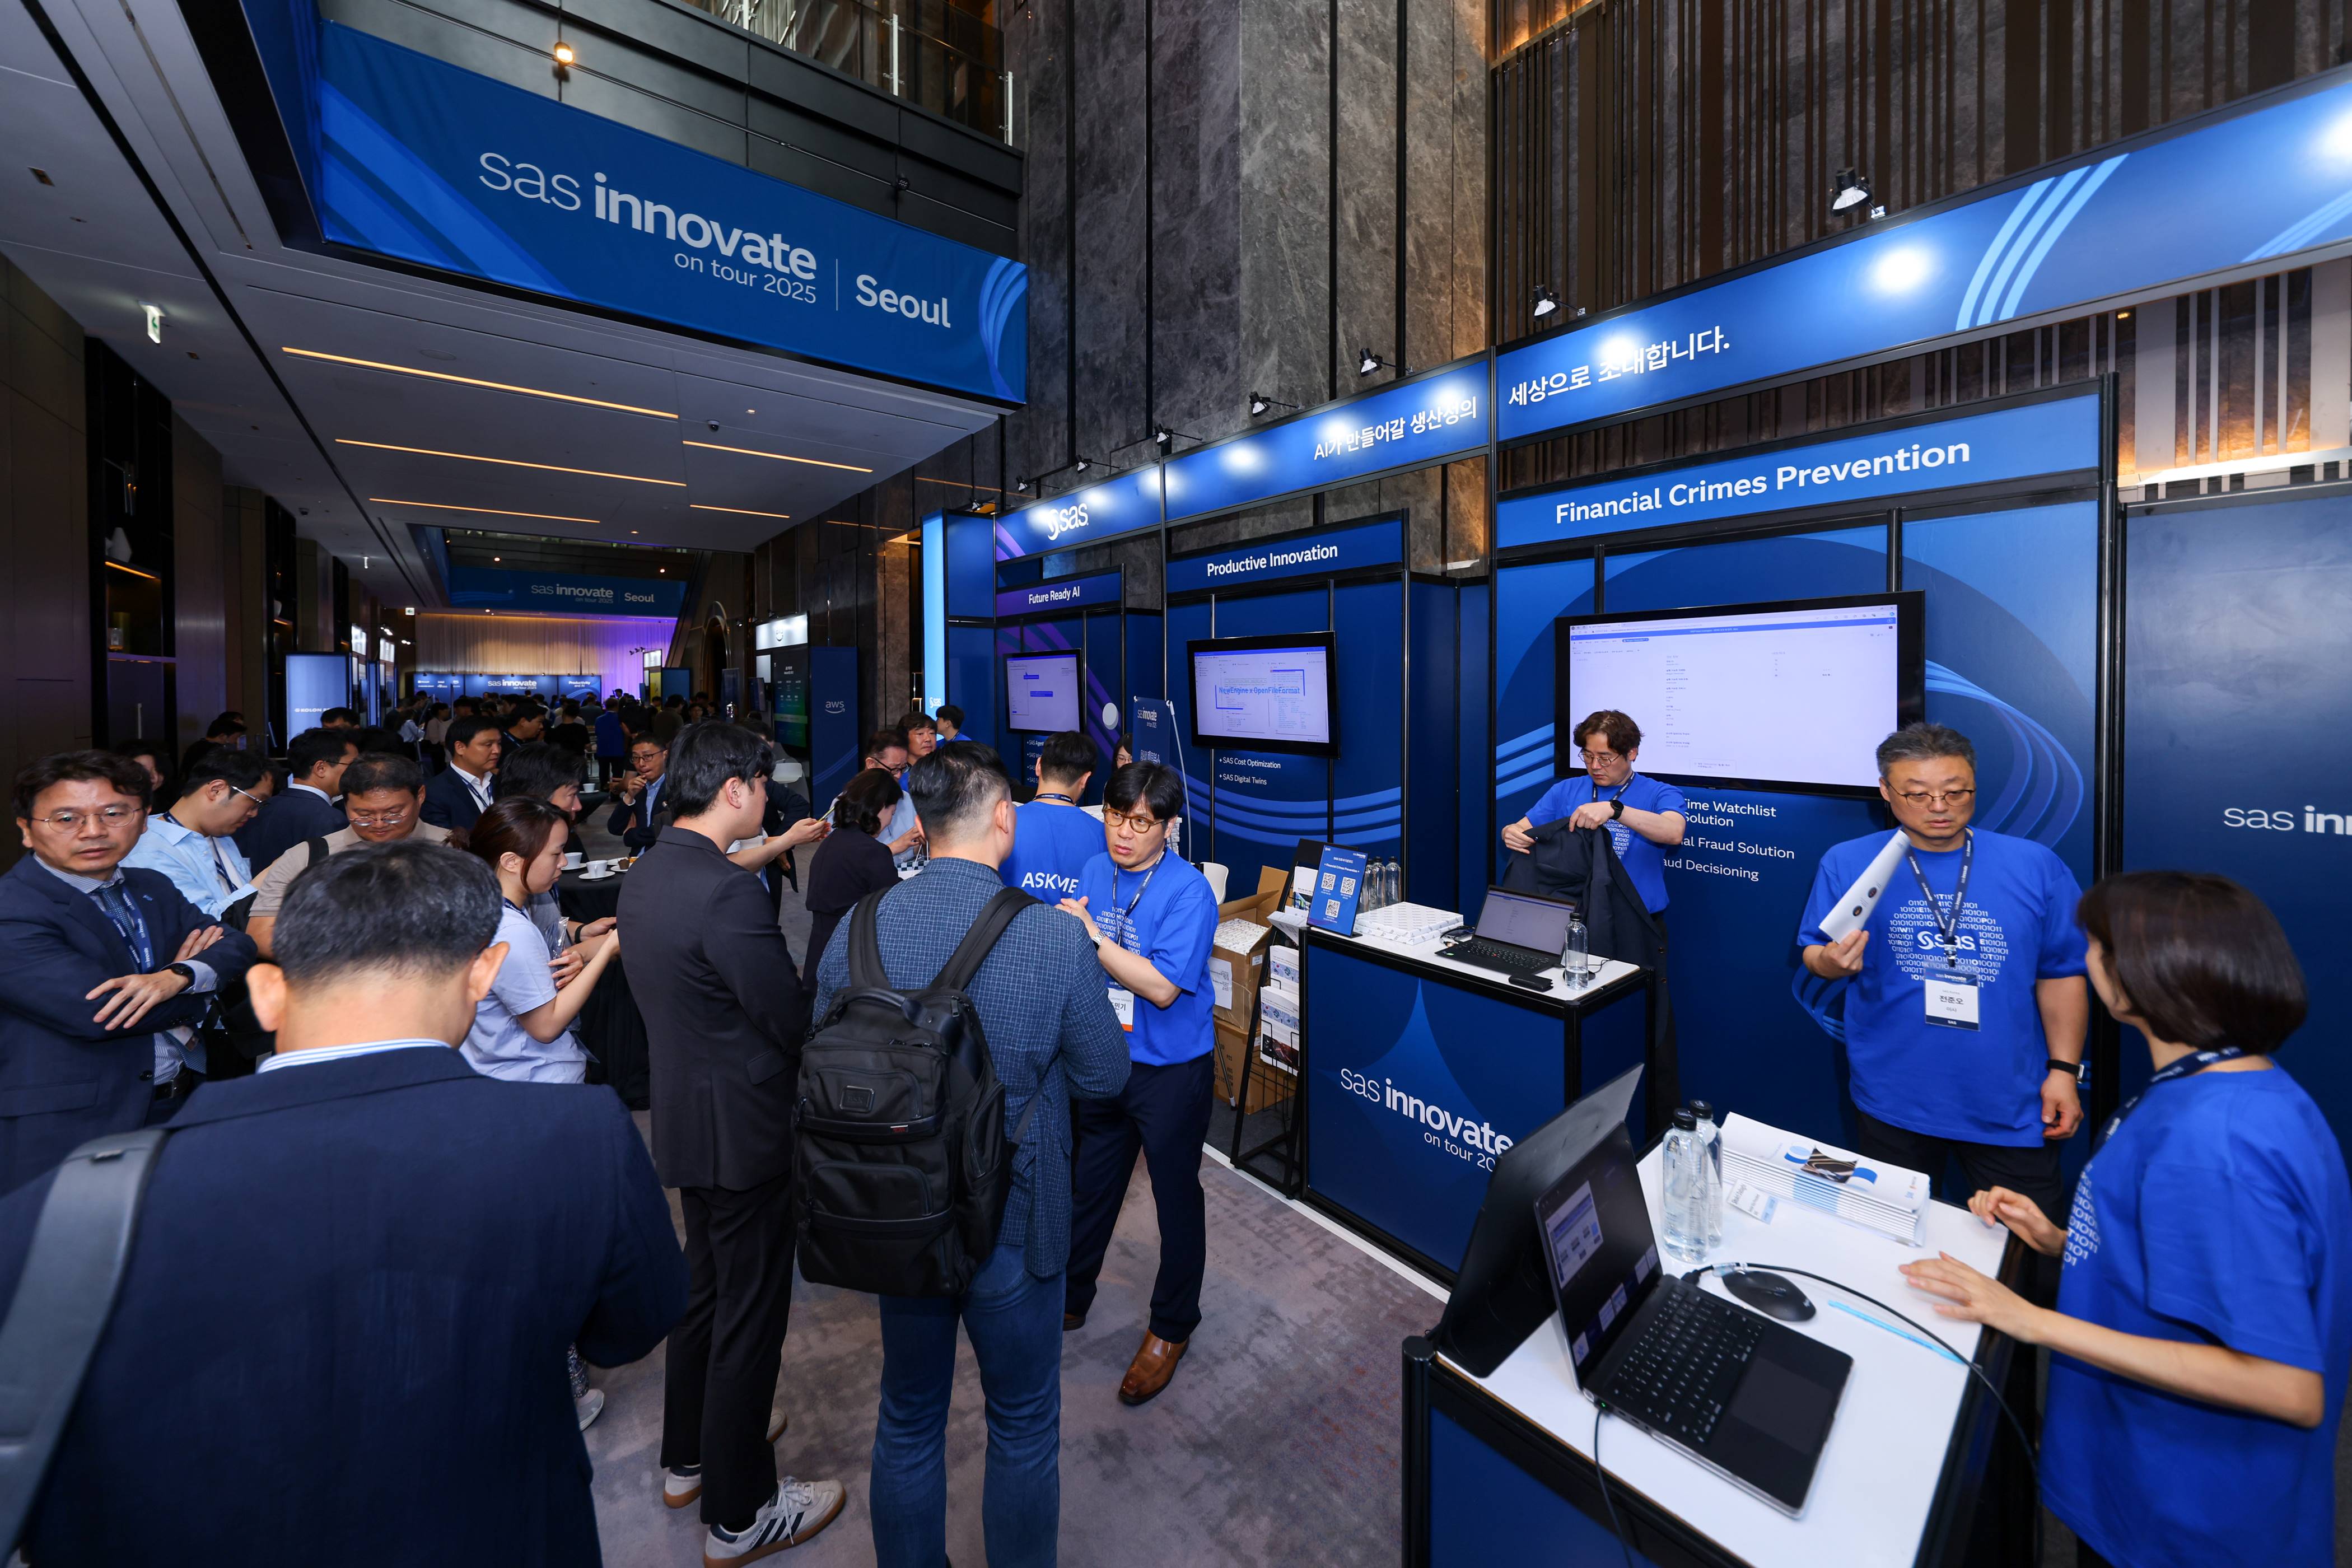
例年と同様に、SAS Instituteはグローバル各国でフォーラムを開催しました。日本ではSAS Forum Japanと題して6月11日に東京の六本木で開催され、また、アメリカSAS本社はダラスでSAS Global Forum 2019を開催(4/28~5/1)し、その中では多数の論文が発表されています。本シリーズでは、これらの論文の中から、OSSとSASプラットフォーム製品のユースケース、OSSコーディング開発・運用事例、クラウドアーキテクチャの設計と運用等々の注目された内容を選別した上で、4回に分けて紹介していきます。 第1回「OSS言語から活用できるオープンなSASプラットフォーム」 近年、OSS(オープンソースソフトウェア)プログラミング言語が数多くのデータサイエンティストや企業によって利用され、分析モデルが開発されています。PythonやR、Luaなどデータサイエンティストや開発者たちに好かれたプログラミング言語はアナリティクス業界に革新をもたらしました。SASはそれらのOSSユーザと企業の要望に応じ、従来のSASユーザとOSSプログラミングユーザーたちが共同作業、かつ連携できるようなプラットフォームを提供しています。 今回は、OSSユーザがどのような方法を利用し、SASプラットフォーム上で自由自在なデータ分析を行えるのかをテーマとし、SAS Global Forumで公開した論文をご紹介します。 1.Open Visualization with SAS® Viya® and Python この論文では、オープンソース言語の一つであるPythonに関し、SAS ViyaのSWAT(Scripting Wrapper for Analytics Transfer)を通じて、メインにオープンソースのグラフィックテクノロジー、特にPythonのMatplotライブラリ、そして現在主流となっているD3の可視化フレームワークとのインテグレーション技術について紹介しています。本文で用いた例は、統計プログラミングのサンプルを使って、Jupyter NotebookからSAS Viyaの機能を呼び出し、最終的に、mpld3で作られた静的なグラフを動的グラフに変更した例となります。 2.SWAT’s it all about? SAS Viya® for Python Users SASは2016の7月にPythonライブラリSWATをリリースしました。それにより、PythonユーザはSASのCASに接続して、SAS Viyaの各種機能を使えるようになりました。SWATを利用することで、SAS言語バックグラウンドを持っていないユーザには、SAS言語ユーザと同じくCASとSAS Viyaの各種機能を使用できるようになります。この論文では、Python SWATを通じて、CASセッションへ接続し、PythonからCASへデータをロードし、さらにCASアクションで実行して分析する一連作業をデモンストレーションの形で紹介します。使用するデータは、SASほかのアプリケーション、例えばVisual Analyticsなどでも利用できる様子を紹介します。 3.Deploying Models Using SAS® and Open Source 近来、機械学習と人工知能の議論はほとんどの時間がモデル開発の議論に費やされています。しかし、モデルによって得られる洞察をどのように効率的にビジネス価値創出に適用するかに関してはほとんど議論されていません。この論文では、モデルの構築に応じ、Docker、Flask、Jenkins、Jupyter、Pythonなどのオープンソースプロジェクトとの組み合わせで、SASを使用してモデルを展開するためのDevOpsプリンシパルの使用例を紹介します。例に使われている関連アプリケーションはグローバルなユーザベースを持つ資産上のレコメンド・エンジンとなります。この使用例は、セキュリティ、待ち時間、スケーラビリティ、再現性に直面する必要があることをめぐってディスカッションします。最後に、その解決策となるソリューションとその課題となる部分を含めて説明します。 4.SAS®
Tag: AI
As you will have read in my last blog, businesses are demanding better outcomes, and through IoT initiatives big data is only getting bigger. This presents a clear opportunity for organisations to start thinking seriously about how to leverage analytics with their other investments. Demands on supply chains have also
Interestingly enough, paperclips have their own day of honor. On May 29th we celebrate #NationalPaperclipDay! That well-known piece of curved wire deserves attention for keeping our papers together and helping us stay organized. Do you remember who else deserved the same attention? Clippit – the infamous Microsoft Office assistant, popularly known as ‘Clippy’.
Jim Harris shares three more examples of how data quality improves AI in Part 2 of his series.
To say Michio Kaku is smart is an understatement. For a science fair in high school, he built a particle accelerator made of 400 pounds of scrap metal. Have you ever watched the TV show, The Big Bang Theory? Sheldon and Leonard support string theory research on the show. Kaku
Phil Simon says that the downsides of even a few discrepancies can be enormous.
Ante el riesgo de simplificar en exceso, considero que la Inteligencia Artificial (IA) es lo que se vuelve posible después que se ha adoptado totalmente el uso de la analítica y es posible tener mayor audacia sobre cómo utilizarlo para tomar mejores decisiones. Sus modelos mejoran, sus predicciones son más
At the risk of oversimplifying, I think of artificial intelligence as what becomes possible after you’ve fully embraced analytics and you’re starting to get bolder about how to use it. Your models are getting better, your predictions are more accurate, your results are stronger and over all, confidence grows in
Jim Harris shares examples of how and why AI applications are dependent on high-quality data.
SAS, 향후 3년간 AI 분야 10억 달러 투자 계획 발표 R&D 혁신 교육 및 전문가 컨설팅 지원 통해 기업 AI 역량 강화 국내에서도 AI 전문가 교육 프로그램 제공… 인재 양성 및 분석가 저변 확대 2019년 3월 28일 – 세계적인 분석 선두 기업 SAS(www.sas.com/korea)가 향후 3년간 인공지능(AI) 분야에 총 10억 달러(한화 약
Special Feature Section Our special feature section in this 53rd issue of Foresight poses the question, Are You a Victim of Your Models? Here Tom Willemain, a longtime contributor to the journal, ponders why modeling and optimization algorithms haven’t displaced “gut instinct” in supply-chain forecasting as much as one would
Jim Harris says curating AI’s curriculum is the responsibility of data stewards.
In meinem letzten Blogpost ging es darum, welche Aufgaben „Robo A“ mir als Bankmitarbeiter womöglich schon abnehmen kann, sodass ich Zeit für wichtigere Themen gewinne. KI spielt in Banken schon lange keine Nebenrolle mehr. Die Suche nach dem ultimativen Use Case, der einerseits über den Hype und andererseits über den
Vor zwei, drei Jahren war „digitale Transformation“ nur ein Wort. Heute findet sie statt. Handwerk, Industrie, Banken, Gesundheitswesen – überall werden überholte und ineffiziente Strukturen abgelöst. Gerade Dienstleistungen sind schon spürbar schneller, unkomplizierter und besser verfügbar geworden. Und die Services öffentlicher Behörden? Auch dort bewegt sich einiges, aber: Es ist
Lenin ist sauer, saurer sogar, als es Bolschewiken-Art ist. „Ich habe Ihre IoT-Blogs gelesen“, sagt er. Und er ist sauer. Noch auf dem SAS Forum in Bonn hatte er unsere Zusammenarbeit gepriesen und den Stellenwert von Datenanalyse und künstlicher Intelligenz hervorgehoben. Auch Lenins Mitarbeiter waren dort gewesen, die Hornbrillen-Dame und
As one of SAS' newest systems engineers, recently joining the Americas Artificial Intelligence Team, I’m incredibly excited to gain expertise in artificial intelligence and machine learning. I also look forward to applying my knowledge to enable others to leverage the advanced technologies that SAS offers. However, as a recent graduate
Lenin schaut übellaunig wie ein Bolschewik: „Sherlock? Der hat mit leistungsfähiger künstlicher Intelligenz so wenig zu tun wie mit echter Detektivarbeit! Wir brauchen weder Sherlock noch seinen Doktor!“ Lenin hatte mich zum Challenger Workshop eingeladen. Ein Berater der Accelerator Change & Disruption Consultancy (AC&DC) bat nach kurzem Impulsvortrag (Change! Disruption!)
2019년에도 인공지능(AI)은 여전히 모든 기관 및 조직들에게 큰 화두일 것으로 보입니다. 인공지능 기술을 통해 기관은 대량의 데이터를 빠르게 분석하고 반복적인 업무 프로세스를 자동화하며, 투명성을 높임으로써 전반적인 운영 효율을 개선할 수 있습니다. 이러한 혁신은 이제 더 이상 첨단 IT 기업들만의 성공 사례가 아닙니다. 새해를 맞이하여 공공 기관이 효과적으로 AI 전략을 구현하기
„Für mich heißt Internet of Things, dass hier alles rotiert wie in einem Wäschetümmler und es weder Durcheinander noch Stillstand gibt.“ Frau Dönmek hatte Lenin und mich am Werkstor in Cedorf abgeholt und uns gleich in die Halle zu ihrer Anlage geführt: „Wir arbeiten an der Kapazitätsgrenze. Was wir wegen
Data management gets lost in the enthusiasm around Artificial intelligence (AI) and machine learning (ML). Not surprising, when it's an algorithm that decides what search results to show you, guides the self-driving cars on the roads, and powers the anti-fraud bots that monitor every credit card transaction we make. Charles
When describing their business model, our customer, Epipoli (one of the leading gift card companies in Europe), tells the story of the ancient Limoncello makers of Italy. Limoncello is an intensely lemon-flavored liqueur famously produced in Sorrento, the Amalfi coast, and the island of Capri. The drink started as a local tradition, but quickly
Health care is facing an unprecedented need to reform, drive quality and cut costs. Growth in targeted, specific treatments and diagnostic technology, coupled with a rise in people with long-term and multiple chronic conditions, is creating unsustainable demand on the system. To thrive – or even merely survive – health
Artificial intelligence often seems misunderstood, especially in fraud. The same is true of machine learning. One of the amazing things about them is they ask the unasked questions. This occurs as artificial intelligence (AI) and machine learning (ML) go about their daily work. So, what is the unasked question? Too
Deep learning (DL) is a subset of neural networks, which have been around since the 1960’s. Computing resources and the need for a lot of data during training were the crippling factor for neural networks. But with the growing availability of computing resources such as multi-core machines, graphics processing units
AIプラットフォームSAS Viyaでは、「AI実用化」や「AI民主化」を促進するために、従来から自動予測モデル生成や、機械学習やディープラーニングの判断根拠情報の提供などを可能としていましたが、SAS Visual Analytics on SAS Viyaの最新版8.3では、新たに「自動分析」機能が実装されました。 「自動分析」機能を使用すると、予測(ターゲット)に影響を与えている変数の特定や、変数ごとにどのような条件の組み合わせがターゲットに依存しているのかを「文章(条件文)」で表現して教えてくれます。 この例で使用するデータ「HMEQJ」は、ローンの審査を題材にしたもので、顧客ごとに1行の横持ちのデータです。このデータ内にある「延滞フラグ」が予測対象の項目(ターゲット変数)で、0(延滞なし)、1(延滞あり)の値が含まれています。 データリスト内の「延滞フラグ」を右クリックし、「分析」>「現在のページで分析」を選ぶだけで、「延滞フラグ」をターゲット変数に、その他の変数を説明変数とした分析が自動的に行われ、 以下のような結果が表示されます。 分析結果画面内説明: ① ドロップダウンリストで、予測対象値(0:延滞なし、1:延滞あり)の切り替えが可能です。この例では、「1:延滞あり」を選択し、「延滞する」顧客に関して分析しています。 ② 全体サマリーとして、すべての顧客の内、延滞実績のある顧客は19.95%であり、「延滞する」ことに関して影響度の高い変数が順に表記されています。 ③ 「延滞する」ことに関して影響を与えている変数の度合い(スコア)を視覚的に確認することができます。 ④ 「延滞する」可能性が最も高くなるグループ(条件の組み合わせ)が文章で示されています。この例では、③で「資産に対する負債の割合」が選択され、これに応じて文章内の該当箇所がハイライトしています。 ⑤ この例では、③で「資産に対する負債の割合」が選択され、これに応じて「0:延滞なし、1:延滞あり」別の顧客の分布状況がヒストグラムで表示されています。選択された変数が数値属性の場合は、ヒストグラムで、カテゴリ属性の場合は積み上げ棒グラフで表示されます。 分析に使用する説明変数(要因)に関しては、右側の「データ役割」画面内で選択することができます。 以上のように、分析スキルレベルの高くないビジネスユーザーでも、簡単かつ容易に、そして分かり易くデータから有効な知見を得ることができます。 ※AIプラットフォーム「SAS Viya」を分かり易く学べる「特設サイト」へGO!
What’s that buzz on the power line? It’s AI, of course! But what is AIoT, you ask? It is applying artificial intelligence (AI) to data from smart devices connected by the Internet of Things (IoT). AI is the science of training systems to perform human tasks through learning and automation.
Ich blinzele, kann kaum was sehen. Die Sonne scheint mir direkt ins Gesicht. Hell, schmerzhaft, stechend – aber ich weiß, dass alle meine Sinne geschärft sein müssen. Ich bemühe mich zu sehen, was vor mir liegt. Denn ich fahre 60 km/h und fühle mich dabei fast blind. Und um mich
ディープラーニング&画像処理用Python API向けパッケージ:DLPyでは、DLPyの基本的な機能を紹介しました。その中で、ディープラーニングの判断根拠となり得る情報、つまり入力画像のどこに着目しているのかをカラフルなヒートマップとして出力することができるheat_map_analysis()メソッドに触れました。 今回は、heat_map_analysis()メソッドを使用して、ヒートマップを出力する際に指定可能な有効なオプションに関していくつか紹介します。 GPU活用 ヒートマップ解析時の判別(予測)処理再実行回避 ヒートマップ出力対象画像タイプ(正・誤判別)指定 ヒートマップ出力対象画像指定 1.GPU活用 SAS Viyaのディープラーニングでは、ネットワークの層ごとにGPUを使用するかどうかの指定が可能ですが、ヒートマップを出力する際にも、指定したテストデータをモデルに当てはめての予測処理は実行されることになるので、同様にGPUを使用することが可能です。 GPUを使用することで、ヒートマップ出力の時間を短縮することができます。 2.ヒートマップ解析時の判別(予測)処理再実行回避 最初にheat_map_analysis()メソッドを実行する際には、モデルにテストデータを当てはめて判別(予測)処理が行われますが、以降、heat_map_analysis()メソッドを使用して、必要な判断根拠情報を再出力する際には、最初の実行時に計算された値を再利用するので、都度再計算(判別・予測処理)は行わず、より効率的、迅速に、ヒートマップを出力することができます。 「1.GPU活用」でのheat_map_analysis()メソッドではパラメータとして「data=te_img」が指定され、モデルにテストデータを当てはめていましたが、下記の再実行の例では、このパラメータは指定されず、結果のメッセージにも「Using results from model.predict()」と、実行済みの計算結果が使用されている旨が表示されています。 3.ヒートマップ出力対象画像タイプ(正・誤判別)指定 ディープラーニングのモデルにテストデータを当てはめて判別(予測)した結果として、正しく判定された画像と間違った判定が下された画像があります。 heat_map_analysis()メソッドの「img_type」パラメータを使用し、正:”C”(Correct Classification), 誤:“M”(Miss Classified), すべて:“A”(All)、を指定して該当画像の判断根拠情報を出力することが可能です。 以下は、誤判別された画像(img_type=‘M’)の判断根拠情報出力例です。 画像のどの部分に着目して、間違った判断に至ったのかを確認することができるので、モデル精度を改善するためには、学習用にどのような画像が必要なのかといった、示唆も与えてくれます。 4.ヒートマップ出力対象画像指定 heat_map_analysis()メソッドの「filename / image_id」パラメータを使用し、特定の画像を指定して、出力することも可能です。 以下は、画像ファイルリストの上位2つの画像のヒートマップをファイル名指定で出力している例です。 以下は、画像ファイルリストの先頭の画像のヒートマップをID指定で出力している例です。 上記例の詳細に関しては、こちらのGitfubサイトをご覧ください。 DLPyの詳細に関しては、こちらのGithubサイトをご覧ください。
前回は、SASの「Pipefitter」の基本的な使用方法を紹介しました。続く今回は、基本内容を踏まえ、ひとつの応用例を紹介します。 SAS Viyaのディープラーニング手法の一つであるCNNを「特徴抽出器」として、決定木、勾配ブースティングなどを「分類器」として使用することで、データ数が多くないと精度が出ないCNNの欠点を、データ数が少なくても精度が出る「従来の機械学習手法」で補強するという方法が、画像解析の分野でも応用されています。 以下は、SAS Viyaに搭載のディープラーニング(CNN)で、ImageNetのデータを学習させ、そのモデルに以下の複数のイルカとキリンの画像をテストデータとして当てはめたモデルのpooling層で出力した特徴空間に決定木をかけている例です。 In [17]: te_img.show(8,4) 以下はCNNの構造の定義です。 Build a simple CNN model In [18]: from dlpy import Model, Sequential from dlpy.layers import * from dlpy.applications import * In [19]: model1 = Sequential(sess, model_table='Simple_CNN') Input Layer In [20]: model1.add(InputLayer(3, 224, 224, offsets=tr_img.channel_means)) NOTE: Input
SASでは、Python向けパッケージ/ライブラリとして、機械学習のパイプラインの実装を簡素化する「Pipefitter」を提供しています。 SASの「Pipefitter」パッケージは、SAS Viyaまたは、SAS v9の反復可能なワークフローの一つの段階として、データ変換とモデルフィッティング向けパイプラインを開発するためのPython APIを提供します。 このパッケージを使用すると、SASでデータを操作して、次のような処理を実装できます: ・欠損値補完 ・デシジョンツリー、ニューラルネットワーク、およびその他の機械学習テクニックを使用したパラメータ推定値の適合 ・ハイパーパラメータチューニングを使用したモデル選択の高速化 ・スコアリングとモデル評価 「Pipefitter」のもう一つの重要な特徴は、SASが提供する他の2つのPythonパッケージの能力に基づいていることです。 SWAT: SAS Viyaプラットフォームのインメモリー分析エンジンであるSAS Cloud Analytic Services(CAS)を活用し様々なデータ操作や分析を可能にするPython向けパッケージ SASPy: SAS9.4の機能を活用し、分析、データ操作、および視覚化を行うためのPython向けパッケージ ロジスティック回帰でのパラメータ推定などのパイプライン処理は、SASPyを介してSAS 9で、SWATを介してCASで同じように実行されるように設計されています。 以下は、タイタニック号の乗船者データに基づくパイプラインの例です。 まず、KaggleのサイトからPandas DataFrameにデータをダウンロードします。 In [1]: import pandas as pd In [2]: train = pd.read_csv('http://s3.amazonaws.com/assets.datacamp.com/course/Kaggle/train.csv') In [3]: train.head() Out[3]: PassengerId Survived Pclass 0 1 0 3 1 2 1