Authors: Varun Valsaraj and Julia Moreno
In 2023, the Applied AI Modelling (AAIM) team established a reusable LLM-SAS Integration framework for a digital assistant. It uses natural or conversational language input interpreted by a Large Language Model (LLM) to carry out tasks and scenario analysis from SAS Optimization on SAS Viya. In this post, we will demonstrate how we built a digital assistant for a warehouse space optimization use case. By using the LLM-SAS Integration framework, we enabled both technical and non-technical users to interact with an optimization model and view the output by using natural language conversation.
Companies dedicate a lot of time and effort to building interfaces that enable less technical users to utilize analytics. Take, for example, workers at a Consumer Packaged Goods (CPG) company. They use SAS to generate their forecast for Supply Chain Operations planning. At the CPG company, the data scientist builds an optimization model and forecasting model for several decision-planning uses. Then the non-technical users (such as warehouse specialists and logistics operators) engage with the models to aid in key planning decisions, such as choosing the number of trucks needed to transport stock, the amount of safety stock needed at distribution centers, and so forth. Without the technical knowledge, this becomes complex and time-consuming for the warehouse specialist or logistics operator. Instead, they can use Gen AI through an AI-powered digital assistant. This enables any non-technical user to use natural or conversational language to run the analytics, build multiple scenarios, and understand the result of analytics. This solution provides a quick and easy-to-use interface for all users to interact with analytics.
Overcoming Generative AI hallucination issues
One of the well-known issues with Generative AI (GenAI) is the problem of hallucinations or incorrect responses given with confidence from Large Language Models. GenAI excels at generating text and interacting with users to understand their queries. Unfortunately, this skill does not extend to answering analytical questions with precision in that it is prone to inventing answers or giving nonsensical responses. This lack of analytical accuracy makes it tough for companies to act on analytical results created by using GenAI. We can prevent mathematical-related hallucinations by integrating SAS' trustworthy AI with GenAI. In the LLM-SAS Integration framework, all analytics results are generated by SAS in the back end, while GenAI is only used to interact with users to gather inputs to trigger the analytical models and surface results that are repeated for the end user. This significantly reduces the problem of GenAI hallucinations, as the AI is no longer responsible for analytics but merely repeats the answer retrieved from SAS. This enables companies to confidently make decisions with speed and precision.
Warehouse space optimization
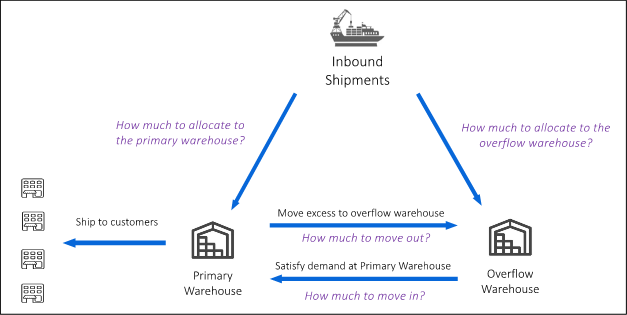
Warehouse space optimization, the assignment of the limited space within a warehouse across multiple products, is one of the key supply chain decisions. Forecasted demand for the product is a key input that is used for the assignment. Companies often have an overflow warehouse, where they can send excess inventory or route incoming shipments of products with excess inventory. There are three key decisions that the Supply Chain team needs to finalize during the weekly operations meetings if the primary warehouse is close to its capacity (see Figure 1):
- Amount of product that needs to be moved out from the primary warehouse to the overflow warehouse.
- Amount of product that needs to be moved from the overflow warehouse back to the primary warehouse.
- Allocating inbound shipments either to the primary warehouse or the overflow warehouse.
Companies often solve this warehouse space optimization problem manually by using an Excel spreadsheet. This can present a few challenges. First, it can take hours every day for specialists to determine the best distribution of stock and update the system. Second, results might be suboptimal, as optimization is often applied one row at a time instead of analyzing all the input data concurrently. Third, it is difficult to incorporate constraints to the optimization model, such as the target warehouse utilization for the primary warehouse, in the Excel analysis. Finally, Excel analysis is not ideal for less technical users, who might need the help of data scientists to make sense of the analytical results when they are delivered. To overcome these challenges, our team built a digital assistant that enables users to solve warehouse space optimization by using open source technology on the front end while integrating GenAI and SAS analytics on the back end.
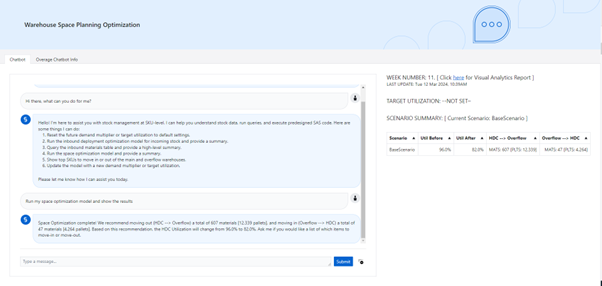
Figure 2 shows the assistant's layout. Upon startup, the right pane shows the Week Number (week of the year), a link to the SAS Visual Analytics report, the set target warehouse utilization, and summaries of any scenarios and their details. On the left pane, we see the chatbot window with an extra tab detailing how the optimization model and chatbot work.
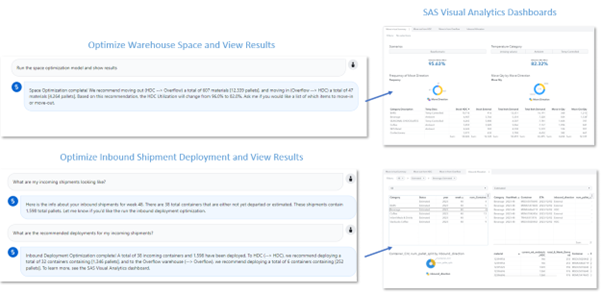
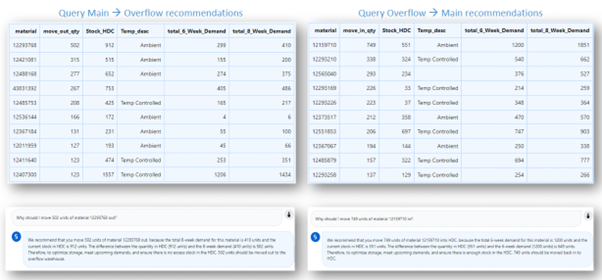
Some of the capabilities built on the previous iteration of the chatbot demonstrate precisely how we can integrate SAS and GenAI in a user-friendly way. The back end of the digital assistant provides two optimization models. The first utilizes PROC OPTMODEL to optimize the movement of inventory between the primary and overflow warehouses to satisfy customer demand and maintain target warehouse utilization. The goal here is to minimize the total inventory movement between warehouses. The second utilizes a set of customer-defined rules to optimize the allocation of inbound shipments to the right location, either the primary or overflow warehouse. This ensures adequate inventory in the primary warehouse and decreases unnecessary reallocation of materials in the future. These answer our first main business questions and can be seen in the snippets in Figure 3.
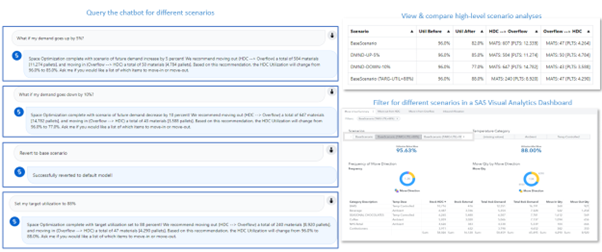
Warehouse specialists might wish to compare scenarios of different target warehouse utilization; for example, set the target utilization to 88%. Or workshop different demand scenarios, such as What happens if my demand goes up by 5%?– in case of changes in the future. These can both be seen in Figure 4. After each scenario runs, the list of scenarios in the right pane is updated and can be compared at a high level. For a more in-depth comparison, users can switch to view the data in a SAS Visual Analytics dashboard and filter for different scenarios. These are updated in real-time as the user interacts with the chatbot.
However, a warehouse specialist might not understand the complex equations at work behind the optimization model. Another functionality of this iteration of the digital assistant is explainability, as seen in Figure 5. Users can ask why a certain result was given, and the chatbot will explain at a high level how the optimization model makes decisions. This gives both technical and non-technical users the confidence and understanding to make their decisions.
Finally, an additional feature available through this chatbot is the ability to interact with and filter output data from the chatbot in an automatically updated SAS Visual Analytics dashboard containing all scenarios.
These game-changing capabilities showcase integration between trustworthy SAS Analytics and Generative AI. Users can trigger SAS scripts and view the output in the user interface and a SAS Visual Analytics dashboard.
Project architecture
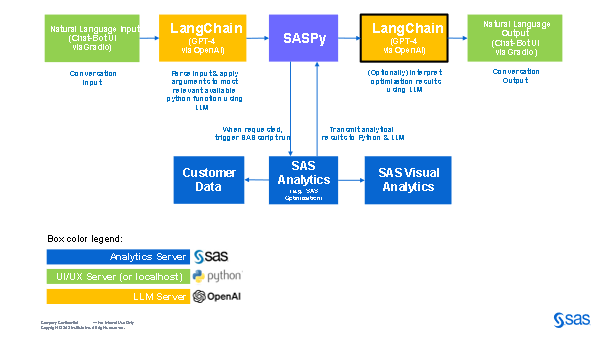
This project represents an implementation of the same architecture as a digital assistant to aid users in a recipe optimization problem. It combines Python and SAS with different components distributed across three separate servers, as shown in Figure 6.
- UI/UX Server (green boxes):
- The chatbot interface is built by using the Gradio library in Python. This server (or localhost) runs Python along with UI/UX elements and handles LLM-based interactions by using the LangChain library.
- Analytics Server (blue boxes):
- This server hosts the customer data, runs SAS Viya, and can also host a SAS Visual Analytics dashboard if desired. The recipe optimization problem is coded by using PROC OPTMODEL and is run on the analytics server.
- LLM Server (orange boxes):
- This server hosts the LLM, which is ‘GPT-4’ in our case. The LangChain agent is initialized in the UI/UX server, and API calls are made from the agent to this server to understand which tool needs to be executed.
Component customization
SAS script
This piece of the digital assistant was customized to the use case. This enabled us to plug and play with pieces of the assistant without changing the overall infrastructure. A completely different SAS Script was used for this digital assistant.
LangChain prompts and tools
There are many different prompts and tools or Python functions available to the LLM that we pass in the back end to the LLM so that it behaves accordingly, including Prefix, Suffix, Format instructions, and tool descriptions. For a more detailed explanation of each of these, see here. For this, we changed only a sentence in the Prefix, and we wrote new tools (Python functions) to interact with the optimization model and output as needed (see Use Case section), each with its own description.
SAS Visual Analytics dashboard creation
Unlike the previous digital assistant, this use case also includes a SAS Visual Analytics dashboard. The dashboard is populated with data from the optimization model and subsequent scenario analyses after a command from the UI is run. This enables the user to easily compare and interpret results at a fine-grained level, similar to how the customer performed this analysis before but integrated with SAS Analytics and the chatbot.
Aesthetic interface changes
In addition to the practical changes noted above, there were a few changes made to the interface, such as the display of base and alternate scenarios on the right pane, the link to the SAS Visual Analytics dashboard, and info about the current scenario. These were cosmetic changes and can be easily made by subsequent users.
Summary
This project demonstrates how the SAS digital assistant architecture can be repurposed for a warehouse optimization use case, with only small tweaks made to the original recipe optimization digital assistant code. With these changes, users can use conversational language to optimize stock distribution between warehouses, assess incoming shipments, run scenario analyses, and view all output data in a SAS Visual Analytics Dashboard, tasks previously achievable only by data scientists and analysts. The integration of the black box technology of Generative AI and SAS Optimization enables both non-technical and technical users to create and use a trustworthy analytical framework to solve optimization use cases and more. This infrastructure has been used by other SAS teams for demos in the banking and education industries and is currently being expanded for a supply chain optimization use case.