Can we use Computer Vision (CV) to recognize the identity of over 500 Galapagos sea turtles by using just an image? This was the question asked of SAS by researchers at the Galapagos Science Center (GSC), a joint partnership between the University of North Carolina at Chapel Hill’s (UNC) Center for Galapagos Studies and Universidad San Francisco de Quito in Quito, Ecuador. Literature suggests that it should be possible because sea turtles have a unique set of facial scales, like a human fingerprint. Therefore, no two turtles share the exact same scale pattern. In partnership with the GSC, the SAS Data Ethics Practice decided to find out. This Data for Good project offered the opportunity to explore and analyze vast quantities of data, collected by GSC researchers Daniela Alarcón and Juan Pablo Muñoz-Pérez, over the last decade.
Data set: I3S Database
Researchers in the field routinely and safely capture sea turtles to inspect their health. This involves checking fin tags to verify the identity and then measuring weight, size, carapace, and beak dimensions. They also make sure there haven’t been any harmful interactions with plastic or vessels in the water. While doing so, they take photographs of the turtles, which we can use to train CV models. However, not every photo contains the information we need. For example, there might not be a side profile of the turtle where the facial scales are clearly visible. Figure 1 shows some images that include the scales and many other types of photographs captured.
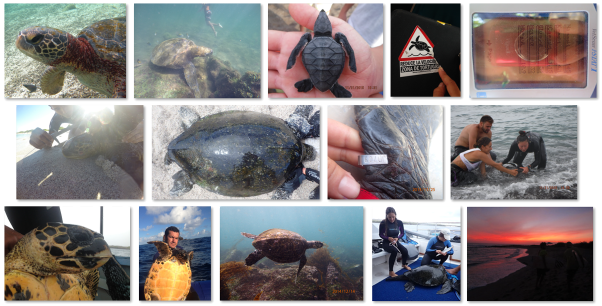
There’s also the added complexity of handheld photography on mobile devices compared with CCTV scenarios in fixed locations with predictable lighting. There are a variety of daylight conditions and difficulties of photography in and around the sea. Issues include under/overexposure, motion blur, noise (underwater artifacts, sand, etc.), as well as the turtles’ images being captured from many different distances and angles.
Thanks to the efforts of the Data for Good volunteer team, over 5,000 of the initial 12,000 images were marked as ‘usable’ for our model training. In each of these 5,000 images, we have the face of the turtle and crucially we know the identity of it. Images remained where researchers had not identified a turtle. But for CV tasks to be able to start, we generally require labeled data.
SAS Visual Analytics – Who, when, and where?
A SAS Visual Analytics dashboard was created while the image data was being processed. This gave researchers the ability to view their data in a way they had never been able to before. Held within each image is a series of metadata objects that very simply enabled us to view “Who, When, and Where” for each image. Over 6,000 images contained latitude and longitude data, which were plotted with the image capture timestamp. The turtle ID provided by researchers created data points in space and time. An example of this is shown in Figure 2. Every data point on the map represents a single turtle image, with interactive filters enabling users to filter by individual turtle or species throughout the time period.

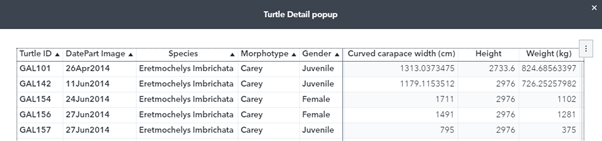
Suddenly, researchers were able to track the population of the 538 turtles they had been monitoring for over ten years via an intuitive and easy-to-use dashboard interface. This was all from their photograph data. In their terminology, this represented an ‘Index of Health’ which they can use to monitor the location and well-being of turtles over time. Extra data, such as measurements and weights recorded by the researchers, supplement the location data via drill-down tables within the dashboard. This is shown in Figure 3. We can also ingest freely available data sources, for example, weather data from NOAA which allows for monitoring of unusual weather events and how that interacts with the turtle data.
Computer Vision overview
A CV pipeline was developed to have the following repeatable steps to score a new, ‘unseen’ image:
- Extract image metadata to send to SAS Visual Analytics.
- Detect turtle head and scales side profile region, if it exists within the image.
- Extract the cropped image at full resolution for further processing.
- Predict the turtle’s species and morphotype.
- Predict the identity of the turtle.
Many CV techniques were implemented throughout the pipeline. SAS DLPy provided a Python interface to develop, train, test, and deploy CV models. SAS tools included YOLO object detection to extract the scales region, Darknet image classification for morphotype and species prediction, and U-Net instance segmentation to remove as much background noise as possible around the scales. Applying these models gave us a close crop on the scale area, which we could use to recognize the individual.
There is also the action for feature recognition or template matching between images. This action works well with precise matches between images (such as logo detection) in which the target object retains the same shape, form, and detail.
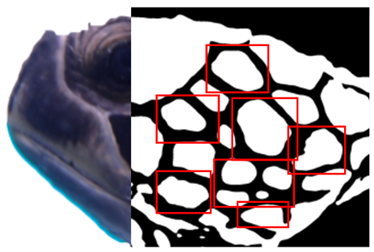
Figure 4 shows how we applied preprocessing (grayscale, blur, binarization, and contour analysis) to isolate scales for template matching between images. However, the noise, rotation, and variability in the appearance of scales were too high for our data.
Turtle recognition
The state of the art in feature recognition continues to advance. In June 2023, an open source framework and paper titled LightGlue: Local Feature Matching at Light Speed were published. In them, the model is trained on photographs of man-made architecture. The authors even mention that the model might be suitable for use in recognizing fish scales. The model detects pairs of keypoints from images A and B, so it does not provide a ‘classification’ but rather a quantitative result of the number of keypoints. So, we must decide on a threshold for MATCH or NO MATCH.
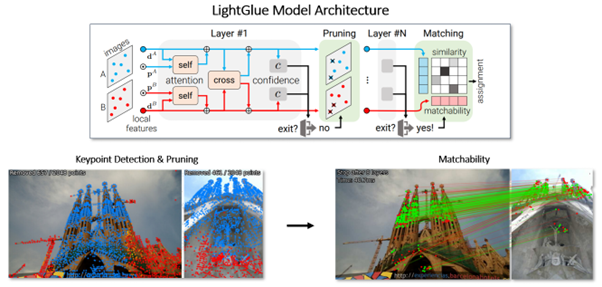
Figure 5 shows how LightGlue compares two images of the Sagrada Familia and iteratively assesses keypoints between them. In each layer, the points are evaluated in similarity and kept/discarded to produce a final list of common keypoints in the images over the confidence threshold.
The model architecture helps tackle many of the complexities in recognizing keypoints from two different images that might be subject to changes in perspective, object rotation, object distance, noise, and lighting. In our context, this gives us a robust method to find common keypoints in the turtle scales area which can then be used to decide whether two images do or do not belong to the same turtle.
True positive test
In Figure 6, we test the model on two images of the same individual, GAL340. The images were captured in quick succession, but there are slight differences in the angle of the head, occlusions above the eye, and in the scales hidden by the neck. We can see the keypoints that were assessed, discarded, and selected as a match.
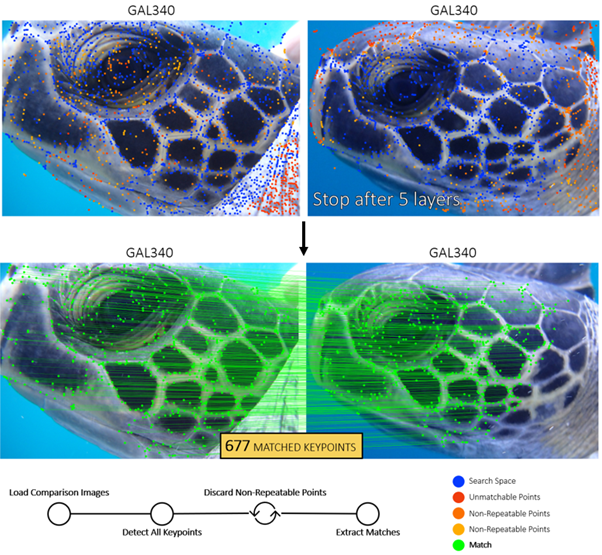
We can see how the model does a thorough job of detecting keypoints along the contours between scales. The top and far-right scales are occluded in the first image. We can see this because of the clean boundaries in the second image’s keypoints that show which scales are not fully visible.
False positive test
We must also test the model on two different individuals to check if false positives could be an issue. In this case, we compare images of two turtles of the same species (lower contrast between scales implies higher difficulty) and in the same orientation for a fair assessment, as shown in Figure 7.
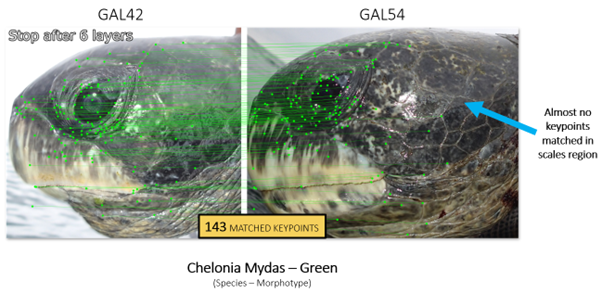
We learned from tests like these that eyes and beaks are not as unique as the scales. So this can result in keypoints being matched. Crucially though, the model does an excellent job of confirming that the scale area (or fingerprint) of the individual is not a match, with barely a dozen matching keypoints in this area. So, some interpretation of the keypoints metric is important. Equally, we could consider preprocessing by using segmentation to extract only the scales and nothing else on the face.
Population search test
In Figure 8, we randomly select an image of GAL212 and carry out a population-wide search covering 446 unique turtles and 782 images where the scales are visible. The turtle identities are hidden from the model. The goal is to find a different image belonging to the same turtle with enough matching keypoints to decide that it is a match.
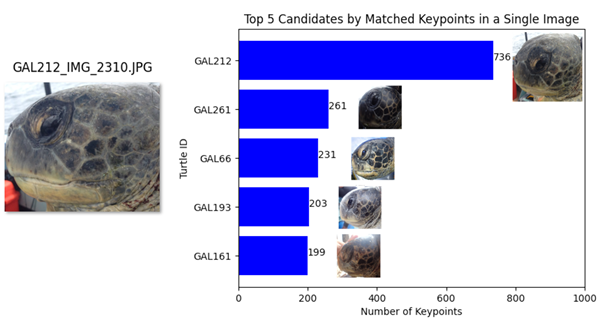
We see that a different image of GAL212 returns the highest matched keypoints by a considerable margin. Data challenges remain, but these tests show us that for future research, our pipeline is capable of detecting matches and results that are highly transparent and explainable.
Tools and technologies
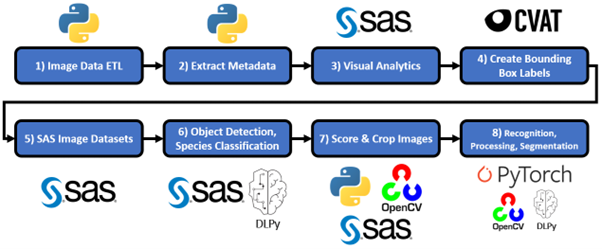
The life cycle of the project serves as a template for how you can tackle a CV problem with a combination of open source tools and SAS software. This is demonstrated in Figure 9. With SAS it is easy to combine typical CV technologies like Python, OpenCV, PyTorch, and CVAT with the SAS Viya platform supporting data management, preprocessing, modeling, and deployment.
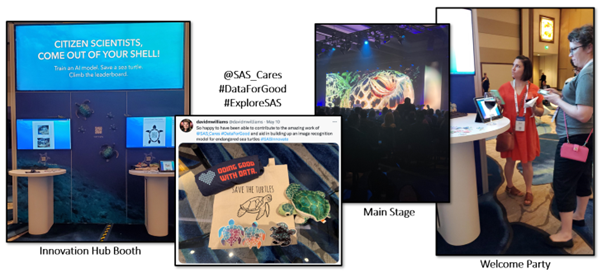
ConserVision: Turtles on tour
An application developed by SAS Solutions Factory was featured at SAS Innovate and SAS Explore. Conference attendees could get hands-on experience with the image data to help label thousands of images containing unknown turtles. Results were gathered and analyzed after the events to help us and the researchers identify unknown turtles from the collection of over 20,000 images captured without knowing the individual. These were then fed into a SAS Visual Analytics dashboard.
Summary
In this post, we covered the story of how SAS and the Galapagos Science Center are collaborating to help save sea turtles by using CV. An end-to-end pipeline was created by using SAS and open source technologies. This combination extracts image metadata for an Index of Health in SAS Visual Analytics and processes the image to predict the species, morphotype, and identity of a turtle. This process is the first of its kind and can be repeatable for sea turtles worldwide. It could also be used for other animals with unique features to help researchers and conservationists in their efforts to monitor and protect endangered species that are vital to the ecosystem.
“Projects like this are proof we can change the world one algorithm at a time”
Reggie Townsend, SAS Vice President of Data Ethics
What comes next is delivering the results and solution to the researchers so they can use it on their own images and those submitted by locals, tourists, or turtle enthusiasts!