Managing supply chain network operations is a key challenge for SAS customers. This is because inventory holding and logistics costs have a major impact on a company’s profits. Furthermore, supply chain complexity, market uncertainty, and operational risk make it difficult to determine profit-optimal decisions. The following describes how we overcame this challenge by creating a digital twin of the supply chain enabling profit-optimal decisions under uncertainty. We will present a high-level description of the supply chain digital twin development at SAS.
What is a supply chain digital twin?
Envision the following use case. A major consumer packaged goods (CPG) client wanted to:
- predict product shortages
- identify the bottlenecks that cause the supply chain to experience low fill rates
- determine the corrective actions to take to reduce the risk of future shortages
In other words, could we build a digital twin of the supply chain to predict problems? And could we identify solutions to fix future problems before they happened?
A supply chain digital twin is a virtual representation of real-world supply-chain entities and processes. Its digital and physical counterparts are synchronized at a specified frequency and fidelity (Digital Twin Consortium 2021). The expectation of the digital twin is that it will provide enhanced visibility into the future of supply chain operations. As well, it enables playing operational “what-if” games before the implementation of a decision or a policy.
How to build supply chain digital twin
We custom-built a digital twin for this client through the integrated use of several SAS applications to represent, visualize, simulate, analyze, and optimize the supply chain operations:
- SAS DATA and PROC steps retrieved, wrangled, and analyzed supply chain data
- SAS® Visual Analytics visualized the supply chain
- SAS® Simulation Studio simulated the supply chain
- SAS® Visual Data Mining and Machine Learning accelerated the “what-if” games
- SAS® Optimization helped to identify the corrective actions
As a result, our client is now equipped with the power to continuously optimize their supply chain using a digital twin.
Supply chain network flow
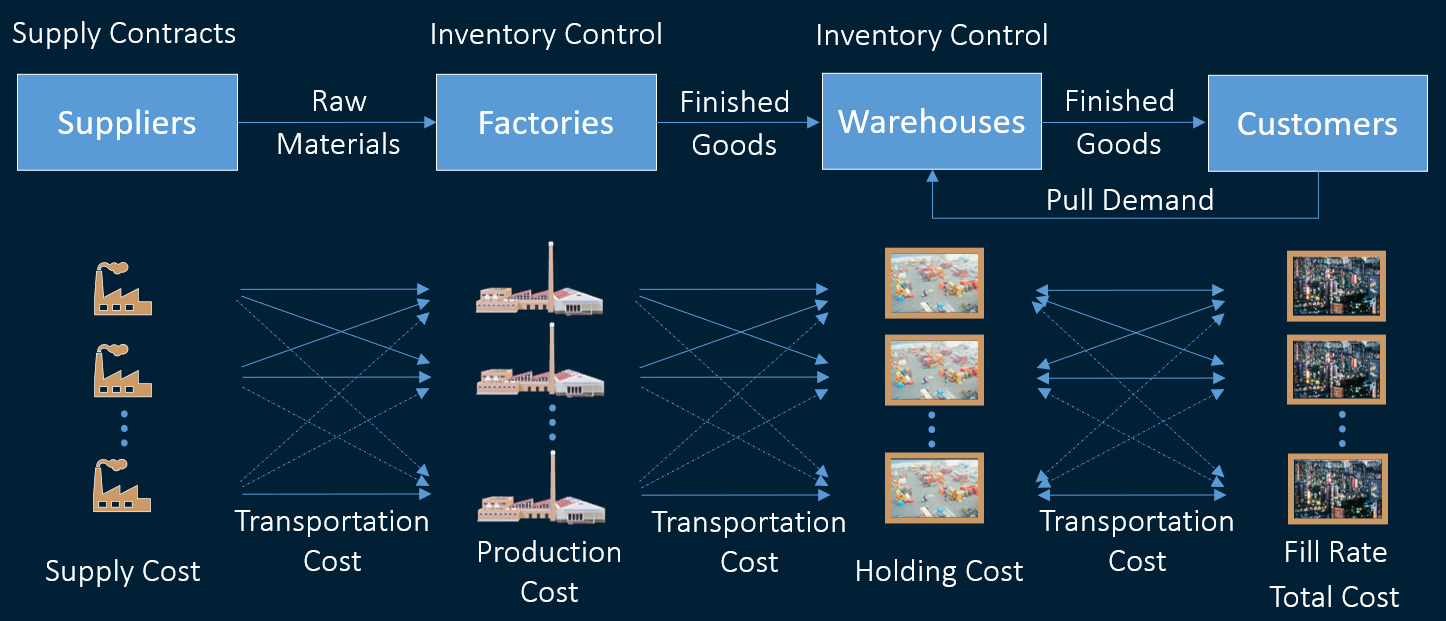
The development of a supply chain starts with the description of the supply chain network flow. Motivated by the CPG industry, Figure 1 shows the flow of a multitiered network composed of suppliers, factories, warehouses, and customers. There is also a transportation channel between each pair of tiers.
At first glance, the illustration might indicate one supplier, one factory, one warehouse, and one customer pool. Nevertheless, at the heart of the supply chain digital twin development lies a flexible supply chain simulation model that is data-driven and scalable with the number of suppliers, factories, warehouses, and customers. Furthermore, the flow might appear to be moving in a single direction. However, underlying information flow is much more complicated. Warehouses replenish finished goods inventory from factories whereas factories replenish component inventory from their suppliers.
Each of these events must happen at the right time for the right quantities. Thus, there is a complex logic to the network flow moving both forward and backward. It requires the implementation of plans to manage suppliers, production, transportation, and inventory throughout the supply chain. Figure 1 also shows fill rate and total cost as two generic key performance indicators (KPIs). The goal of the supply chain digital twin is to mimic this flow for the following reasons:
- predict various KPIs and gain visibility into the future of the supply chain operations
- assess the impact of operational policies and investment decisions in a virtual environment
- stress test the supply chain and identify the best courses of action to take when faced with disruptions
Once the supply chain network configuration is identified, the next step is to collect all relevant information and data which fully describe the supply chain. A generic list of input data sets includes:
- supply contracts and supplier data
- initial inventory
- production plan
- customer demand
- transportation details
- inventory control policies
- supply chain cost parameters
- characterization of disruptive events.
The disruptive event list could include loss of inventory and/or capacity due to natural disasters or disturbances such as fires, site contaminations, and equipment shutdowns. However, the details of data collection and definition are dependent on the types of decisions that the supply chain digital twin supports. They are further affected by the speed of decision-making.
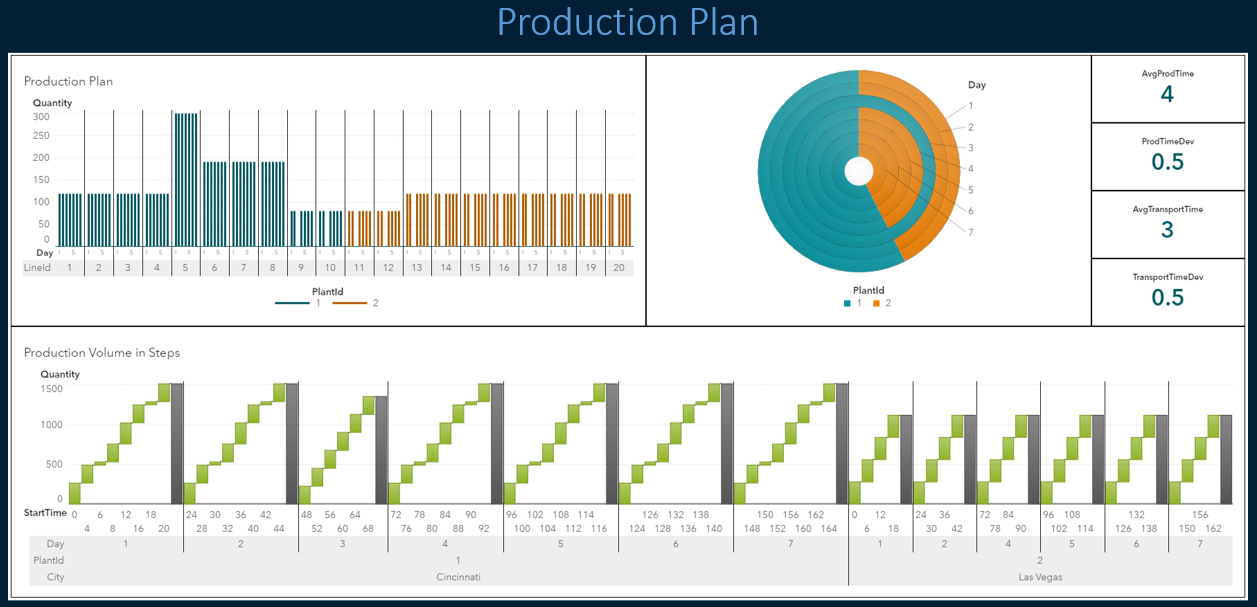
A production plan is an example of the input data that are used to build a supply chain digital twin. Using SAS Visual Analytics, Figure 2 displays the daily quantity of production to take place on each production line in two factories of the production channel. It further illustrates the division of the production plan into hourly buckets with pre-specified production start and end times.
You might wonder where this production plan is coming from. It comes from a production plan optimization solved using SAS Optimization. The supply chain network simulation takes the optimized production plan as an input. It then uses SAS Simulation Studio to quantify the risk of implementing this plan under uncertainty. SAS DATA and PROC steps provide feedback on how the production plan can be improved with an in-depth analysis of the simulation-generated output data. This is how we bring optimization and simulation into a closed-loop reflecting continuous learning in digital twin development.
Supply chain KPI prediction
Combining supply chain network flow with all necessary pieces of information and data completes the characterization of the supply chain logic. This logic is represented in SAS Simulation Studio to mimic the flow of thousands of products. These products are starting as raw materials and ending as finished goods through a network of suppliers, factories, warehouses, and customers with transportation fleets operating among different tiers of the supply chain. However, this is done at a level of detail that is needed to support the way the client plans to use the supply chain digital twin. Furthermore, the supply chain digital twin design aligns with the speed of decision-making.
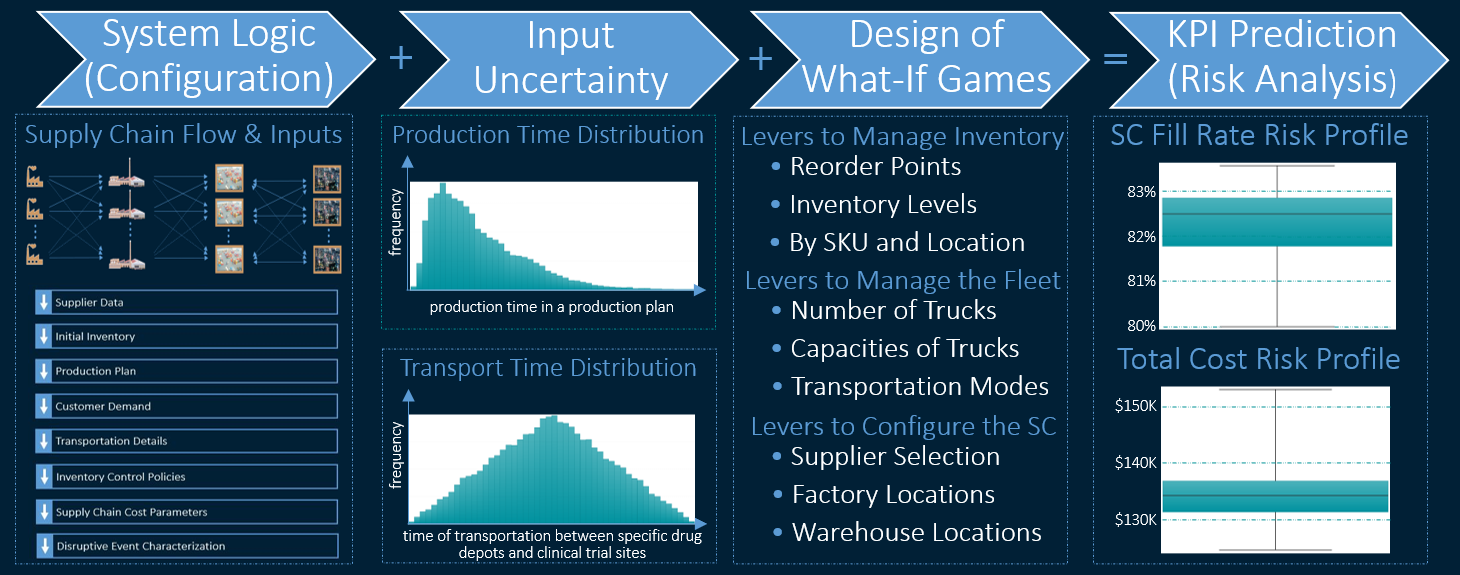
The representation of the supply chain logic in SAS Simulation Studio is followed by the characterization of the uncertainty in the random supply chain inputs. Examples of random inputs include supplier lead-time, production and assembly times, transportation time, and customer demand size. Figure 3 illustrates two example probability density functions - obtained from historical data - to represent the randomness in production-time and transportation-time processes. SAS Visual Analytics plots each of these density functions with the x-axis providing all the possible values production time or transportation time might take. The y-axis shows how likely it is to observe each of these values.
During the simulation of the supply chain network flow, SAS Simulation Studio captures input uncertainty by sampling from these density functions, propagates it throughout the supply chain network, and embeds the effect of uncertainty into the simulation-generated output data.
The next step is to design the “what-if” games. This is done by specifying the levers that the client could be changing in the search for better ways to manage the supply chain. If the purpose of developing the supply chain digital twin is to help improve the management of inventory, then the levers could be chosen as the inventory control parameters. If the goal is to support fleet management, then the levers would likely be chosen as the attributes of the transporters. The lever selection could be further customized to support supply chain reconfiguration decisions.
Next, we execute the supply chain network simulation. Consequently, we generate vast amounts of data representative of how the supply chain might perform in the future. Furthermore, we amass this large amount of data very quickly. By taking advantage of SAS Visual Analytics, Figure 3 shows how box-and-whisker plots illustrate risk profiles for the supply chain fill rate and the total cost. Therefore, not only do we predict the expected values of the two key supply chain KPIs, but we also quantify the risk in their predicted values.
Identification of corrective actions
Our analysis of the supply chain simulation output data is not limited to the prediction of supply chain fill rate and total cost. The supply chain network simulation is designed to generate time-stamped data. This shows the flow of every raw material, work-in-process, and finished goods through the supply chain. This includes the temporal usage of every resource including people, machines, facilities, and transportation fleet across many possible futures that might realize. Using SAS DATA and PROC steps to analyze this supply chain output data set leads to the time-based operational KPIs. This includes flow times, capacity utilization, and inventory fluctuations. Further analysis of these KPIs results in the identification of the supply chain bottlenecks.
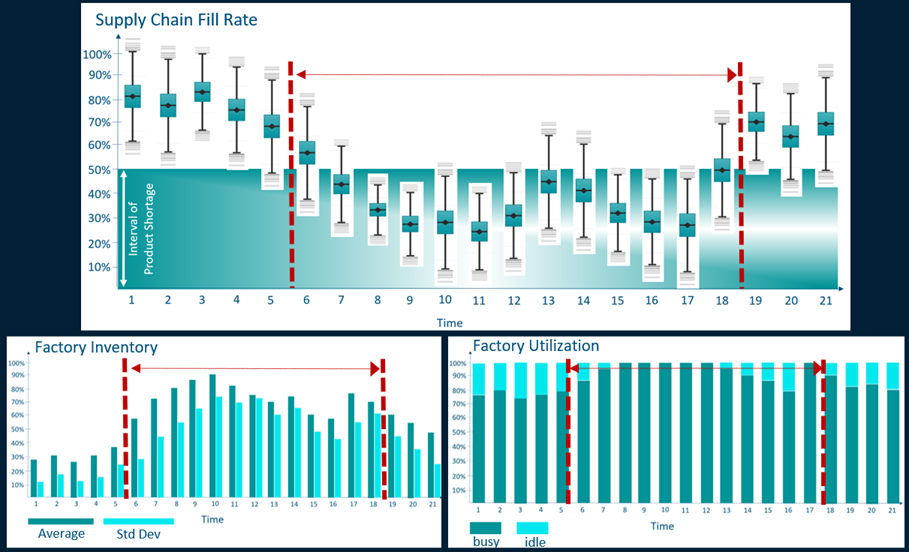
Using SAS Visual Analytics, Figure 4 illustrates how the temporal study of supply chain fill rate together with factory inventory and utilization identifies a specific factory as the bottleneck. It causes the supply chain fill rate to fall below 50% between the 6th and 19th months of the time horizon. This simulation-data-driven insight is critical for the identification of a corrective action to help better manage the supply chain under uncertainty.
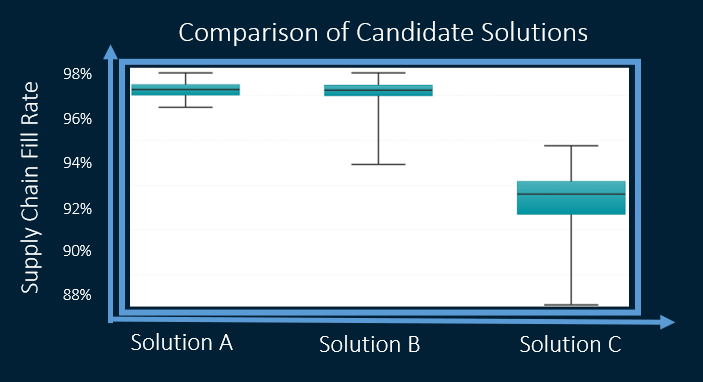
Visualize the following situation. An action to prescribe for the supply chain shortages, illustrated in Figure 4, is adding capacity to the overutilized factory. This can be done in three different ways:
- Purchasing a flexible machine that can perform multiple tasks (solution A).
- Allowing weekend production (solution B).
- Adding a third shift (solution C).
The supply chain digital twin can be used to select which one (or a combination) of these actions to take. Figure 5 illustrates an example (operational) risk profile of the supply chain fill rate for each candidate solution. It suggests that the purchase of a flexible machine (solution A) would not only maximize the supply chain fill rate but also reduce the level of risk exposure. Similar information can be readily obtained from a supply chain digital twin for a wider variety of operational and financial KPIs. This enables the client to make decisions with more information.
Digital twin of a supply chain summary
This post covers the development of a supply chain digital twin. We helped a SAS client gain enhanced visibility into the future of supply chain network operations. At the heart of this custom-built digital twin lies a flexible, data-driven, and scalable network simulation. Because this simulation can be viewed as a large supply-chain data generation program, KPI prediction and optimization can be accelerated through integration with SAS Visual Data Mining and Machine Learning.
We built digital twins customized to our client's supply chains through the integrated use of multiple SAS applications:
- to represent, visualize (SAS Visual Analytics)
- simulate (SAS Simulation Studio)
- analyze (SAS Visual Data Mining and Machine Learning)
- optimize (SAS Optimization) the supply chain operations.
The resulting capability equips our clients with the power to predict supply chain KPIs. It also quantifies the risk in the KPI predictions. As well, they can identify the corrective actions maximizing profit in addition to improving resiliency. The supply chain digital twin also serves as a virtual laboratory to assess the impact of disruptions, operational policies, and investment decisions.


2 Comments
Pingback: Digital transformation opportunities in Africa - SAS Voices
Pingback: How to navigate supply chain risk scenarios - Hidden Insights