This post, co-authored with my colleague Ricky Tharrington, is the first in a three-part series explaining interpretability techniques for complex models in SAS® Viya®.
Interpretability techniques can help overcome challenges with black-box models that make them hard to understand. In this series we'll introduce four model-agnostic interpretability techniques you can use to explain and understand machine learning models, including:
- Partial dependency (PD) plots.
- Independent conditional expectation (ICE) plots.
- Local interpretable model-agnostic explanations (LIME).
- Shapley values.
We'll also demonstrate the use of these techniques in two case studies. For the first case study, we will use Model Studio application in SAS Viya, and for the second case study we will use the SAS Viya programming interface.
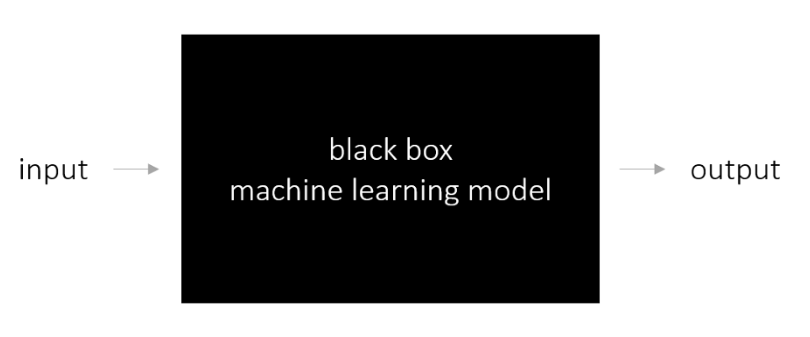
Understanding black-box models
Modern machine learning algorithms can make accurate predictions by modeling the complex relationship between inputs and outputs. The algorithms build predictive models by learning from the training data, and then make predictions on new observations. Although machine learning algorithms can learn complex relationships, the models that are produced can be equally complex, making it difficult to understand the association between the inputs and outputs. Because of their complexity, many machine learning models are black-box models, producing predictions without explaining why and how they are made.
One example of a black-box machine learning model is a simple neural network model with one or two hidden layers. Though you can write out the equations that link every input in the model to every output, you might not be able to grasp the meaning of the connections simply by examining the equations. This has less to do with the shortcomings of the models, and more to do with the shortcomings of human cognition. Often, the higher the predictive accuracy of a model, the harder it is to interpret its inner workings. This is where interpretability techniques come into play by providing a lens through which you can view these complex models.
Why interpretability matters
Model interpretability can meet different needs for different users, such as regulators, executives, data scientists, and domain experts.
- Regulators need model interpretability to make sure the model makes predictions for the right reasons. For example, if an individual’s loan application is rejected, the loan agency needs to confirm that this decision does not violate any laws that protect certain groups of people.
- Executives need to understand black-box models so that they can logically justify the decisions they make.
- Data scientists (with the help of domain experts) need model interpretability to be able to detect biases that exist in training data, extract new knowledge that is originally hidden in the data, and debug models when they produce wrong and unexpected predictions.

Inherently explainable models vs model-agnostic interpretability
Inherently interpretable models (also called explainable models) incorporate interpretability directly into the model structure, and thus are self-explanatory. One type of commonly used inherently interpretable models is the generalized linear model (GLM), which includes linear and logistic regression. The coefficient estimates of GLMs directly reflect feature contributions; hence, these models can be explained through these coefficients.
More recently introduced examples of inherently interpretable models achieve interpretability by forcing the models to use fewer features for prediction or by enabling features to have monotonic relationships with the prediction (Ustun and Rudin 2015). Another inherently interpretable model is the generalized additive model with pairwise interactions (GA2M). These models enable you to understand the contribution of features through their additive components (Caruana et al. 2015). Overall, constraints on features can make complex models simpler and increase the model’s comprehensibility to users. However, imposing these constraints can also decrease the predictive ability of the model when compared to an unrestricted model.
Model-agnostic interpretability
In this series, we will explore model-agnostic interpretability methods that are used to explain trained supervised machine learning models, such as boosted trees, forests and neural networks. These post-hoc techniques explain predictions of these models by treating the models as black boxes and then generating explanations without inspecting the internal model parameters.
Global and local explanations
Model-agnostic interpretability techniques enable fully complex models to be interpreted either globally or locally. Global interpretability provides explanations about the general behavior of the model over the entire population. For example, global interpretability might explain which variables played an important role in the construction of the model or describe the impact of each feature on the overall prediction of the model. Variable importance plots and partial dependence plots are global interpretability techniques.
In contrast, local interpretability provides explanations for a specified prediction of the model. In general, local interpretability techniques assume that machine learning predictions in the neighborhood of a particular instance can be approximated by a white-box interpretable model such as a regularized linear regression model (LASSO). This local model does not have to work well globally, but it must approximate the behavior of the pretrained model in a small local region around the instance of interest. Then the parameters of the white-box model can be used to explain the prediction of the pretrained model. LIME (local interpretable model-agnostic explanations) and Shapley values are local explanation techniques.
Variable importance
Variable importance tables indicate the statistical contribution of each feature to the underlying model. There are various ways to calculate model-agnostic feature importance. One method includes fitting a global surrogate decision tree model to the black-box model predictions and using the variable importance table that is produced by this simple decision tree model.
Another commonly used approach is permutation-based feature importance as described in Altmann et al. (2010). This approach measures the decrease in model predictive performance when a single feature is randomly shuffled. This technique can be very expensive computationally if the number of predictors is very large, because it requires training a new model (on the perturbed data) for each feature.
If the pretrained model is tree-based (decision tree, gradient boosting, or forest), you can also use the model-specific variable importance table that is generated during the model construction. Generation of these tree-based model variable importance tables is often based on the number of times a feature is used to split data.
Partial dependence (PD) and individual conditional expectations (ICE) plots
Both PD and ICE provide explanations that are based on data perturbation, where the contribution of each feature is determined by measuring how a model’s prediction changes when the feature is altered. Partial dependence (PD) plots depict the relationship between a feature and the average prediction of the pretrained model.
PD plots focus on the average effect of a feature for the entire data, whereas ICE plots focus on the effect of a feature for a single observation (Goldstein et al. 2014), which makes ICE technique a local explanation method. Although ICE is a local explanation technique, it is more related to PD that other local explanation methods. By examining various ICE plots, you gain insight into how the same feature can have a different effect for different individuals or observations in the data.
For more information about how PD and ICE plots are generated in SAS Viya, see Wright (2018).
LIME
LIME (local interpretable model-agnostic explanations) explains the predictions of any model by building a white-box local surrogate model (Ribeiro, Singh, and Guestrin 2016). The method first samples the feature space in the neighborhood of an individual observation with respect to a training data set. Then, a sparse linear regression model, such as LASSO, is trained on this generated sample, using the predictions that are produced by the pretrained model as a target. This surrogate model approximates the behavior of the black-box model locally, but it is much easier to explain by examining the regression coefficients.
Shapley values
Like LIME, the Shapley values explain individual predictions (Kononenko 2010). Different from LIME coefficients, Shapley values for feature contributions do not directly come from a local regression model. In regression models, the coefficients represent the effect of a feature assuming all the other features are already in the model. It is well-known that the values of the regression coefficients highly depend on the collinearity of the feature of interest with the other features that are included in the model. To eliminate this bias, Shapley values calculate feature contributions by averaging across all permutations of the features joining the model. This enables Shapley values to control for variable interactions.
The Shapley values are additive, meaning that you can attribute a portion of the model’s predictive value to each of the observation’s input variables. For example, if you have a model that is built with three input variables, then you can write the predicted value as summation of the corresponding Shapley values plus the average predicted value across the input data set. Note that even though Shapley values are additive, they are not ordered.
Because of computational complexities, there are multiple methods for computing approximations to Shapley values. SAS Viya offers the Kernel SHAP and HyperSHAP methods.
For more information about the SAS Viya implementation of local interpretability techniques in this section, see the chapter “Explain Model Action Set” in SAS Visual Data Mining and Machine Learning 8.5: Programming Guide.