Every day, more than one hundred thousand SAS users visit our website looking for SAS information and resources. Given its importance to our user base, we’re constantly looking for ways to evolve the site. Over the next few months, you’ll notice changes to the support website, changes we believe will
Tech
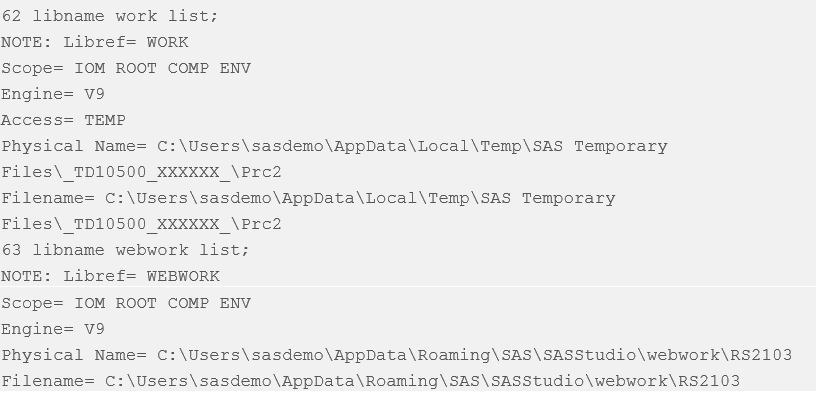
In a previous blog post I explained how end users should code and use shared locations for SAS artifacts, to avoid issues in a SAS Grid Manager environment. Still, they could still fall in some sharing issues, which could have very obscure manifestations. For example, users opening SAS studio might notice
I started out as a Psychology major. During my third year as an undergraduate, I was hired on as a research assistant for my advisor in her cognitive psychology lab. Through this and progressively more complicated psychological research experience, I quickly grew to love statistics. By the end of that
If you use SAS® software to create a report that contains multiple graphs, you know that each graph appears on a separate page by default. But now you want to really impress your audience by putting multiple graphs on a page. Keep reading because this blog post describes how to
The SAS Quality Knowledge Base (QKB) is a collection of files which store data and logic that define data cleansing operations such as parsing, standardization, and generating match codes to facilitate fuzzy matching. Various SAS software products reference the QKB when performing data quality operations on your data. One of
SAS releases regular updates to software products in the form of hot fixes and maintenance releases. Hot fixes are SAS' timely response to customer-reported problems, as well as a way to deliver occasional security-related updates that can affect any software product. At SAS we call them "hot fixes." Other companies
If you’re doing data processing in the cloud or using container-enabled infrastructures to deploy your software, you’ll want to learn more about SAS Analytics for Containers. This new solution puts SAS into your existing container-enabled environment – think Docker or Kubernetes – giving data scientists and analysts the ability to
For a SAS professional, presenting at SAS Global Forum 2017 can be a very rewarding. It can enhance your conference experience, help expand the knowledge of the broader SAS community, and advance your career by putting you on display as an expert SAS professional. It can also be a little
Analysts often use a simple moving average to get an idea of the trends in data. This is simply an average of a subset of time periods, and the size of the subset can differ depending on the application. The technique can be used with data based on time periods,
For many people, building something from scratch, no matter how simple or complex, is fascinating. That’s why programs similar to How’s It Made are so appealing and, for me, addicting. And thus, the inspiration for this blog; I will walk you through building a set of graphs and how to