Recently, one of sons came to me and asked about something called “The Monty Hall Paradox.” They had discussed it in school and he was having a hard time understanding it (as you often do with paradoxes).
For those of you who may not be familiar with the Monty Hall Paradox, it is named for the host of a popular TV game show called “Let’s Make a Deal.” On the show, a contestant would be selected and shown a valuable prize. Monty Hall would then explain that the prize is located just behind one of three doors and asked the contestant to pick a door. Once a door was selected, Monty would then tease the contestant with cash to get him/her to either abandon the game or switch to another door. Invariably, the contestant would stand firm and then Monty would proceed to show the contestant what was behind one of the other doors. Of course, it wouldn’t be any fun if the prize was behind the revealed door, so after showing the contestant an empty door Monty would then ply them with even more cash, in the hopes that they would abandon the game or switch to the remaining door.
Almost without fail, the contestant would stand firm in their belief that their chosen door was the winner and would not switch to the other door.
So where’s the paradox?
When left with two doors, most people assume that they've got a 50/50 chance at winning. However, the truth is that the contestant will double his/her chance of winning by switching to the other door.
After explaining this to my son, it occurred to me that this would be an excellent exercise for coding in Python and in SAS to see how the two languages compared. Like many of you reading this blog, I’ve been programming in SAS for years so the struggle for me was coding this in Python.
I kept it simple. I generated my data randomly and then applied simple logic to each row and compared the results. The only difference between the two is in how the languages approach it. Once we look at the two approaches then we can look at the answer.
First, let's look at SAS:
data choices (drop=max); do i = 1 to 10000; u=ranuni(1); u2=ranuni(2); max=3; prize = ceil(max*u); choice = ceil(max*u2); output; end; run; |
I started by generating two random numbers for each row in my data. The first random number will be used to randomize the prize door and the second will be used to randomize the choice that the contestant makes. The result is a dataset with 10,000 rows each with columns ‘prize’ and ‘choice’ to represent the doors. They will be random integers between 1 and 3. Our next task will be to determine which door will be revealed and determine a winner.
If our prize and choice are two different doors, then we must reveal the third door. If the prize and choice are the same, then we must choose a door to reveal. (Note: I realize that my logic in the reveal portion is somewhat flawed, but given that I am using an IF…ELSE IF and the fact that the choices are random and there isn’t any risk of introducing bias, this way of coding it was much simpler.)
data results; set choices; by i; if prize in (1,2) and choice in (1,2) then reveal=3; else if prize in (1,3) and choice in (1,3) then reveal=2; else if prize in (2,3) and choice in (2,3) then reveal=1; |
Once we reveal a door, we must now give the contestant the option to switch. Switch means they always switch, neverswitch means they never switch.
if reveal in (1,3) and choice in (1,3) then do; switch = 2; neverswitch = choice; end; else if reveal in (2,3) and choice in (2,3) then do; switch = 1; neverswitch = choice; end; else if reveal in (1,2) and choice in (1,2) then do; switch = 3; neverswitch = choice; end; |
Now we create a column for the winner. 1=win 0=loss.
switchwin = (switch=prize); neverswitchwin = (neverswitch=prize); run; |
Next, let’s start accumulating our results across all of our observations. We’ll take a running tally of how many times a contestant who switches win as well as for the contestant who never switches.
data cumstats; set results; format cumswitch cumnever comma8.; format pctswitch pctnever percent8.2; retain cumswitch cumnever; if _N_ = 1 then do; cumswitch = 0; cumnever = 0; end; else do; cumswitch = cumswitch+switchwin; cumnever = cumnever+neverswitchwin; end; pctswitch = cumswitch/i; pctnever = cumnever/i; run; proc means data=results n mean std; var switchwin neverswitchwin; run; legend1 frame ; symbol1 interpol=splines; pattern1 value=ms; axis1 style=1 width=1 minor=none ; axis2 style=1 width=1 major=none minor=none ; axis3 style=1 width=1 minor=none ; title; title1 " Cumulative chances of winning on Let's Make a Deal "; proc gplot data=work.cumstats; plot pctnever * i / areas=1 frame vaxis=axis1 haxis=axis2 lvref=1 cvref=black vzero legend=legend1; plot2 pctswitch * i = 2 / areas=1 vaxis=axis3 vzero overlay legend=legend1 ; run; quit; |
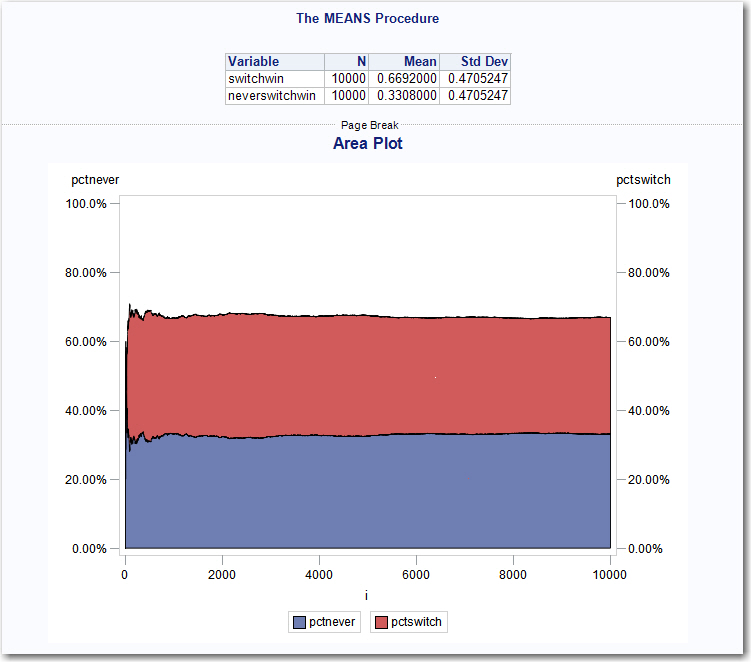
The output of PROC MEANS shows that people who always switch (switchwin) have a win percentage of nearly 67%, while the people who never switch (neverswitchwin) have a win percentage of only 33%. The Area Plot proves the point graphically showing that the win percentage of switchers to be well above the non-switchers.
Now let’s take a look at how I approached the problem in Python (keeping in mind that this language is new to me).
Now, let’s look at Python:
Copied from Jupyter Notebook
import random import pandas as pd import numpy as np import matplotlib.pyplot as plt from itertools import accumulate %matplotlib inline |
First let's create a blank dataframe with 10,000 rows and 10 columns, then fill in the blanks with zeros.
rawdata = {'index': range(10000)} df = pd.DataFrame(rawdata,columns=['index','prize','choice','reveal','switch','neverswitch','switchwin','neverswitchwin','cumswitch','cumnvrswt']) df = df.fillna(0) |
Now let's populate our columns. The prize column represents the door that contains the new car! The choice column represents the door that the contestant chose. We will populate them both with a random number between 1 and 3.
prize=[] choice=[] for row in df['index']: prize.append(random.randint(1,3)) choice.append(random.randint(1,3)) df['prize']=prize df['choice']=choice |
Now that Monty Hall has given the contestant their choice of door, he reveals the blank door that they did not choose.
reveal=[] for i in range(len(df)): if (df['prize'][i] in (1,2) and df['choice'][i] in (1,2)): reveal.append(3) elif (df['prize'][i] in (1,3) and df['choice'][i] in (1,3)): reveal.append(2) elif (df['prize'][i] in (2,3) and df['choice'][i] in (2,3)): reveal.append(1) df['reveal']= reveal |
Here's the rub. The contestant has chosen a door, Monty has revealed a blank door, and now he's given the contestant the option to switch to the other door. Most of the time the contestant will not switch even though they should. To prove this, we create a column called 'switch' that reflects a contestant that ALWAYS switches their choice. And, a column called 'neverswitch' that represents the opposite.
switch=[] neverswitch=[] for i in range(len(df)): if (df['reveal'][i] in (1,3) and df['choice'][i] in (1,3)): switch.append(2) elif (df['reveal'][i] in (1,2) and df['choice'][i] in (1,2)): switch.append(3) elif (df['reveal'][i] in (2,3) and df['choice'][i] in (2,3)): switch.append(1) neverswitch = choice df['switch']=switch df['neverswitch']=neverswitch |
Now let's create a flag for when the Always Switch contestant wins and a flag for when the Never Switch contestant wins.
switchwin=[] neverswitchwin=[] for i in range(len(df)): if (df['switch'][i]==df['prize'][i]): switchwin.append(1) else: switchwin.append(0) if (df['neverswitch'][i]==df['prize'][i]): neverswitchwin.append(1) else: neverswitchwin.append(0) df['switchwin']=switchwin df['neverswitchwin']=neverswitchwin |
Now we accumulate the total number of wins for each contestant.
cumswitch=[] cumnvrswt=[] df['cumswitch']=list(accumulate(df['switchwin'])) df['cumnvrswt']=list(accumulate(df['neverswitchwin'])) |
…and divide by the number of observations for a win percentage.
pctswitch=[] pctnever=[] for i in range(len(df)): pctswitch=df['cumswitch']/(df['index']+1) pctnever=df['cumnvrswt']/(df['index']+1) df['pctswitch']=pctswitch df['pctnever']=pctnever |
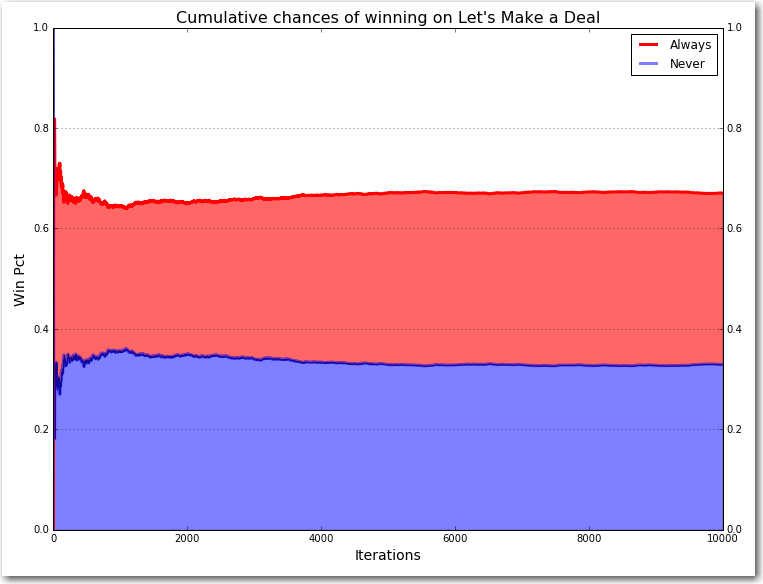
Now we are ready to plot the results. Green represents the win percentage of Always Switch, blue represents the win percentage of Never Switch.
x=df['index'] y=df['pctswitch'] y2=df['pctnever'] fig, ax = plt.subplots(1, 1, figsize=(12, 9)) ax.plot(x,y,lw=3, label='Always', color='green') ax.plot(x,y2,lw=3, label='Never',color='blue',alpha=0.5) ax.fill_between(x,y2,y, facecolor='green',alpha=0.6) ax.fill_between(x,0,y2, facecolor='blue',alpha=0.5) ax.set_xlabel("Iterations",size=14) ax.set_ylabel("Win Pct",size=14) ax.legend(loc='best') plt.title("Cumulative chances of winning on Let's Make a Deal", size=16) plt.grid(True) |
Why does it work?
Most people think that because there are two doors left (the door you chose and the door Monty didn’t show you) that there is a fifty-fifty chance that you’ve got the prize. But we just proved that it’s not, so “what gives”?
Remember that the door you chose at first has a 1/3 chance of winning. That means that the other two doors combined have a 2/3 chance in winning. Even though Monty showed us what’s behind one of those two doors, the two of them together still have a 2/3 chance of winning. Since you know one of them is empty, that means the door you didn’t pick MUST have a 2/3 chance of winning. You should switch. The red line in each of the graphs show that after having run 10,000 contestants through the game the people that always switched won 67% of the time while the people that never switched only won 33% of the time.
My comparisons and thoughts between SAS and Python.
In terms of number of lines of code required, SAS wins hands down. I only needed 57 lines of code to get the result in SAS, compared to 74 lines in Python. I realize that experience has a lot to do with it, but I think there is an inherent verbosity to the Python code that is not necessarily there in SAS.
In terms of ease of use, I’m going to give the edge to Python. I really liked how easy it was to generate a random number between two values. In SAS, you have to actually perform arithmetic functions to do it, whereas in Python it’s a built-in function. It was exactly the same for accumulating totals of numbers. In Python, it was the accumulate function. In SAS, it was a do loop that summed each of the previous values.
In terms of iterative ability and working “free style,” I give the edge to SAS. With Python, it is easy to iterate, but I felt myself having to start all over again having to pre-define columns, packages, etc., in order to complete my analysis. With SAS, I could just code. I didn’t have to start over because I created a new column. I didn’t have to start over because I needed to figure out which package I needed, find it on Github, install it and then import it.
In terms of tabular output, SAS wins. Easy to read, easy to generate.
In terms of graphical output, Python edges SAS out. Both are verbose and tedious to get it to work. Python wins because the output is cleaner and there are way more options.
In terms of speed, SAS wins. On my laptop, I could change the number of rows from 10,000 to 100,000 without noticing much of a difference in speed (0.25 – 0.5 seconds). In Python, anything over 10,000 got slow. 10,000 rows was 6 seconds, 100,000 rows was 2 minutes 20 seconds.
Of course, this speed has a resource cost. In those terms, Python wins. My Anaconda installation is under 2GB of disk space, while my particular deployment of SAS requires 50GB of disk space.
Finally, in terms of mathematics, they tied. They both produce the same answer as expected. Of course, I used extremely common packages that are well used and tested. Newer or more sophisticated packages are often tested against SAS as the standard for accuracy.
But in the end, comparing the two as languages is limited. Python is much a more versatile object oriented language that has capabilities that SAS doesn’t have. While SAS’ mature DATA step can do things to data that Python has difficulty with. But most importantly, is the release of SAS Viya. Through Viya’s open APIs and micro-services, SAS is transforming itself into something more than just a coding language, it aims to be the analytical platform that all data scientists can use to get their work done.

15 Comments
If you used the multiprocessing library you could really make this Python code fly. That would exceed the SAS performance by many orders of magnitude.
Doubtful. I can run these in SAS Viya to improve performance. SAS Viya runs multi-threaded, distributed, and in-memory by default. Multi-processing Python would take it from walking to running, whereas Viya takes it to a race car.
But, with the data volumes used in the exercise the point is mostly moot.
Thanks for reading and commenting!
Here's my Python code: https://github.com/NickDoesData/monty_hall/blob/master/Monty%20Hall.ipynb
Zangror's code above runs on my computer in less than 3 seconds for 10,000 observations and 10 seconds for 100,000 observations. While it still doesn't equate to SAS' performance, this is a marked improvement and proves the point that regardless of the hardware, performance is still largely in the hands of the coder.
If your code runs slow, it's easy to blame the computer or maybe even the language, but you should always take a hard look at your code and see if your contributing to the problem. Oftentimes, you are. As was the case for me in this example.
As with SAS, the Python community is strong and helps each other improve their Python code. I look forward to improving my Pythonic skills and working with you in the community. The improvements suggested here show me that I've got a lot of work to do in changing my coding paradigm. I've been programming in SAS for so long that it's going to take a while to start thinking in Python. It's not unlike learning to write with your non-dominant hand.
Hello Andrew,
Quite interesting from comparing SAS and Python.
As a Python lover, I took the time to rewrite your Python code in pure Python and Pandas style.
import pandas as pd
import numpy as np
import matplotlib.pyplot as plt

# Create the data frame
df = pd.DataFrame.from_dict({
    'door_with_prize': np.random.randint(1, 4, 10000),
    'door_choice': np.random.randint(1, 4, 10000)
})

# Reveal the door
def reveal_door_function(row):
    choices = tuple({1, 2, 3} - {row['door_with_prize'], row['door_choice']})
    return int(np.random.choice(choices))

df['revealed_door'] = df.apply(reveal_door_function, axis=1)

# Make the not switch strategy
df['never_switch_strategy'] = df['door_choice']
# Make the switch strategy
def switch_function(row):
    return tuple({1, 2, 3} - {row['revealed_door'], row['door_choice']})[0]
df['switch_strategy'] = df.apply(switch_function, axis=1)

# Now compute when the switch or the non switch strategy win
df['never_switch_strategy_win'] = (df['never_switch_strategy'] == df['door_with_prize']).astype(int)
df['switch_strategy_win'] = (df['switch_strategy'] == df['door_with_prize']).astype(int)

# Do a cumulative sum of the strategies
df['cum_never_switch_win'] = df['never_switch_strategy_win'].cumsum()
df['cum_switch_win'] = df['switch_strategy_win'].cumsum()

# Divide by the number of observations for a win percentage
df['percentage_never_switch_win'] = df['cum_never_switch_win'] / (df.index + 1)
df['percentage_switch_win'] = df['cum_switch_win'] / (df.index + 1)

axis = df[['percentage_switch_win', 'percentage_never_switch_win']].plot.area(stacked=False)
axis.set_xlabel("Iterations", size=14)
axis.set_ylabel("Win Pct",  size=14)
plt.title("Cumulative chances of winning on Let's Make a Deal", size=16)
plt.grid(True)
Much readable, more Pythonic and run faster 🙂
Is it possible to update your post ?
Kind regards
Okay pasting is not an option..
See my code there: https://0bin.net/paste/lLtXYs+6YCDzFC7T#Ez6Q4F9R0AlT1WdzUk7GJ7DmmQt6S6O2QJvJs9vfPFD
Add some salt into Chris's code.
proc sgplot data=work.cumstats; band x=i lower=pctnever upper=pctswitch/ fillattrs=graphdata2 transparency=0.5; band x=i lower=0 upper=pctnever/ fillattrs=graphdata1 transparency=0.5; series x=i y=pctswitch / y2axis lineattrs=graphdata2(thickness=2) legendlabel='Always' smoothconnect name='b'; series x=i y=pctnever / lineattrs=graphdata1(thickness=2) legendlabel='Never' smoothconnect name='a'; keylegend 'b' 'a'/position=topright location=inside across=1 noborder; xaxis label='Iterations'; yaxis max=1.0 grid; y2axis max=1.0; run;If you used SAS/IML, the SAS code could be even smaller. See Rick Wicklin's approach here.
And if you use PROC SGPLOT instead of GPLOT, you'll save even more lines.
Thanks, Chris! You beat me to it. SAS programmers appreciate the compactness (and speed!) of SAS/IML for running simulations.
This is great! I also didn't feel I understood the problem during stats class until I simulated in python. Thanks for sharing all your code.
Can you do this in R? Ajit
You most certainly can do this in R. See, for example, solution on RosettaCode.org.
This is my take on the problem in R. http://www.econinfo.de/2016/03/12/so-i-finally-understood-monty-hall/
Without counting the lines, I think it is much cleaner than either SAS or Python, as you don't need to set up anything.
I understand that many of you could write this in fewer Python lines than I did. I could probably shorten my SAS code too if I tried. But, that was not really my point. I tried to take an honest, "natural" approach to the coding and then share my experiences. My goal is to get more proficient in Python and share more of my experiences.