Have you ever heard the phrase “beggars can’t be choosers”? Basically, it means that if you ask for something, be grateful for what you get, especially if you don’t have the means to acquire it yourself. This phrase can be widely applicable to most areas of our lives, but when it comes to preparing data in SAS Viya, beggars can be choosers.
SAS Viya has many tools for preparing your data: you can write code in SAS Studio, create plans in SAS Data Studio, or prepare data within reports in SAS Visual Analytics. Because each of these tools has its own features and functions, you may find yourself wondering, which tool should I use?
The answer, like the answer to many questions, is it depends. What are you trying to do? What skills do you have? How quickly does the data need to be ready to use? How many people will be using the data and how?
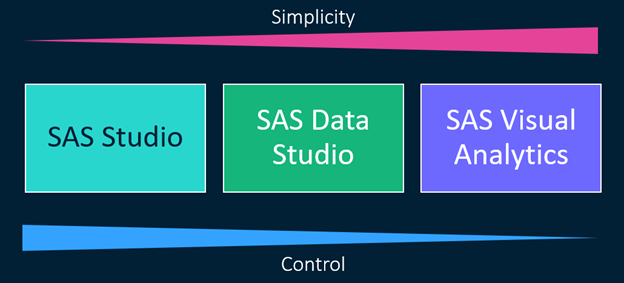
The tool you choose will boil down to two factors: (1) simplicity and (2) control. For example, let’s say you need to create a calculated column quickly. The easiest way to create this column is within SAS Visual Analytics. You can create the new column without having to switch tools. SAS Visual Analytics is great for preparing data with little effort (no code needed) and limited control (limited options available).
On the other hand, let’s say you need to perform a more complex action like transposing or appending data sets, or standardizing values. SAS Visual Analytics, while easy to use, doesn’t have the features available for this level of data preparation. Instead, you can create a plan in SAS Data Studio to prepare your data. SAS Data Studio is great for preparing data with moderate effort (little to no code needed) and moderate control (more options available).
If you want to have full control, you can write code in SAS Studio to prepare your data. SAS Studio is great for preparing your data with more effort (may require some coding) and full control (unlimited options).
So, you can really think about it as a tradeoff between simplicity and control. To perform more complex data preparation tasks, you need more control.
I like to think about it in the context of drawing. Let’s say I want to draw an elephant. Before I start to draw, I need to think about how much time I have available (simplicity) and the level of detail I want to include in my drawing (control).
If I’m playing Pictionary, a charades-inspired word-guessing game where you draw a picture so your teammate can identify a specific word, I want to draw the simplest picture possible so my teammate can guess the word as quickly as possible. I don’t need to create the best-looking picture in the world; I just need my teammate to guess correctly in the shortest amount of time. SAS Visual Analytics is the Pictionary version of my elephant.
On the other hand, if I want to sketch a cute picture of an elephant for my niece’s birthday card, I may want to spend a bit more time on the drawing and add some additional details like eyes and a mouth. SAS Data Studio is the birthday card sketch version of my elephant.
If I’m interested in creating a real-life approximation of an elephant, however, I may want to spend a lot more time and add a lot more detail like shading. SAS Studio is the real-life drawing version of my elephant.
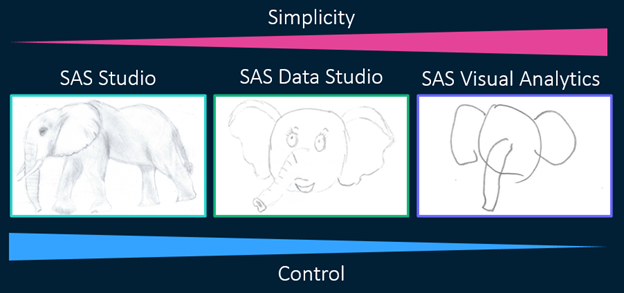
Note: The SAS Visual Analytics version took me about 5 seconds to draw, the SAS Data Studio version took me about 5 minutes, and the SAS Studio version took me an hour.
Now you’re probably wondering, when do I use each tool?
SAS Visual Analytics
Use SAS Visual Analytics in the following scenarios:
- Modifying properties: modify properties of data items (names, formats, classifications, aggregations).
- Filters: create subsets of the data for the report (data source filters) or specific objects (basic filters, advanced filters, post-aggregate filters, common filters). Note: Post-aggregate filters, basic filters, and common filters can only be created in SAS Visual Analytics.
- Calculated items: create a simple calculation, like number of days to delivery (calculated item) or percent of total (aggregated measure) or custom groupings (custom categories). Note: Due to their dynamic nature, aggregated measures can only be created in SAS Visual Analytics.
- Hierarchies and geography data. Note: Hierarchies and geography data items can only be created in SAS Visual Analytics.
- A simple join between two tables based on equality condition (for example, T1.Date = T2.OrderDate).
- Mapping data sources: select a value in an object that uses Table A and filter the associated values in an object that uses Table B (mapping) and the common column between Table A and Table B is used by both objects. Note: Mapping data sources can only be performed in SAS Visual Analytics.
- Aggregated data sources: create an aggregated version of the table.
- Data views for ad-hoc analysis: changes made to data in SAS Visual Analytics are available only for the specific report. To apply data changes to other reports that use the same data source, you can create and share a data view, but you cannot use that prepared data outside of SAS Visual Analytics.
SAS Data Studio
Use SAS Data Studio in the following scenarios:
- Improve data quality with casing, parsing, extraction, identification analysis, generating matchcodes, standardizing, or matching and clustering.
- To discover and address unknown problems in your data using the Suggestions.
- Append tables or transpose.
- Create a join between two or more tables (maximum is 32) based on equality condition (for example, T1.Date = T2.OrderDate) or when the common column between the data sources is calculated (for example, datepart(T1.Date) = T2.OrderDate).
- Write custom DATA step or CASL code to perform any required data preparation action.
- To create tables used for many reports, by many analysts, and in different Viya tools. Note: Jobs can be created from plans and scheduled to run at specific times to ensure the data is up-to-date.
Note: You can also modify the properties of data items, create subsets of the data, and create calculated items in SAS Data Studio.
SAS Studio
Use SAS Studio in the following scenarios:
- Programming with SAS Data Quality: improve data quality programmatically with casing, parsing, extraction, identification analysis, generating matchcodes, standardizing, or matching and clustering.
- Create a non-equi join (for example T1.Date > T2.EndDate) between two or more tables or when the common column between the data sources is calculated (for example, datepart(T1.Date) = T2.OrderDate).
Note: You can use the SQL procedure or CASL code to perform the join.
Note: The DATA step can be used to combine tables where the name of the column is the same in each table.
- Programming with the DATA step: perform complex conditional logic, use arrays, or process data iteratively using the DATA step.
- Programming with SQL: perform any action that requires the use of SQL code (creating subqueries, using set operators, inserting rows into tables, updating values in a table, using DICTIONARY tables, and more).
- Using SAS procedures: use any SAS procedure not associated with a transform in SAS Data Studio (for example, FORMAT, REPORT, FREQ, UNIVARIATE, and more).
- Programming with macros: generate dynamic code based on data or user input using the SAS macro language.
- Create tables used for many reports, by many analysts, and in different Viya tools.
Note: Jobs can be created from SAS code and scheduled to run at specific times to ensure the data is up-to-date.
Note: You can also modify properties of data items, create subsets of the data, create calculated items, create custom groupings, create aggregated tables, append and transpose data, and write custom DATA step or CASL code in SAS Studio.
Summary
The following table summarizes the data preparation actions you can perform in each tool.
| Action | SAS Visual Analytics | SAS Data Studio | SAS Studio |
| Modify properties of data items (names, formats, classifications, aggregations) | ✓ | ✓ | ✓ |
| Filter the data | ✓ | ✓ | ✓ |
| Filter specific objects in a report | ✓ | ||
| Create simple calculations | ✓ | ✓ | ✓ |
| Create custom groupings | ✓ | ✓ | ✓ |
| Create dynamic aggregated measures | ✓ | ||
| Create hierarchies | ✓ | ||
| Create geography data items | ✓ | ||
| Map data sets to apply interactions between two objects that use different data sources | ✓ | ||
| Perform simple joins between two tables based on equality condition | ✓ | ✓ | ✓ |
| Perform joins between more than two tables (up to 32) based on equality condition | ✓ | ✓ | |
| Perform joins when the common column needs to be calculated | ✓ | ✓ | |
| Perform non-equi joins | ✓ | ||
| Create an aggregated table | ✓ | ✓ | ✓ |
| Append tables | ✓ | ✓ | |
| Transpose tables | ✓ | ✓ | |
| Improve data quality with transforms | ✓ | ||
| Improve data quality programmatically | ✓ | ||
| Determine data issues using Suggestions | ✓ | ||
| Write DATA step code | ✓ | ✓ | |
| Write CASL code | ✓ | ✓ | |
| Write SQL code | ✓ | ||
| Use SAS procedures | ✓ | ||
| Use SAS macro language | ✓ | ||
| Perform ad-hoc analysis | ✓ | ✓ | ✓ |
| Create tables used for many reports | ✓ | ✓ | |
| Schedule actions to run on a repeatable basis | ✓ | ✓ |
 For more information about how to use SAS Visual Analytics to prepare your data and create advanced reports, check out my book Interactive Reports in SAS Visual Analytics: Advanced Features and Customization.