Get the right information, with visual impact, to the people who need it
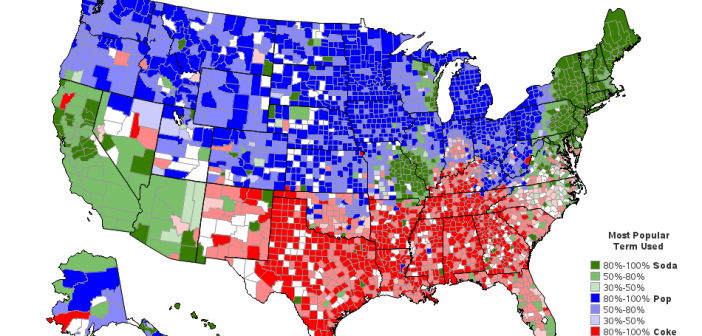
Quick Quiz! Where might you hear the following conversation? ... Waitress: "What would you like to drink, honey?" Customer: "I'll have a coke." Waitress: "What kind?" Customer: "Diet Pepsi." If you answered somewhere between Texas and Georgia, you would be correct! To those of us not from that area, it

