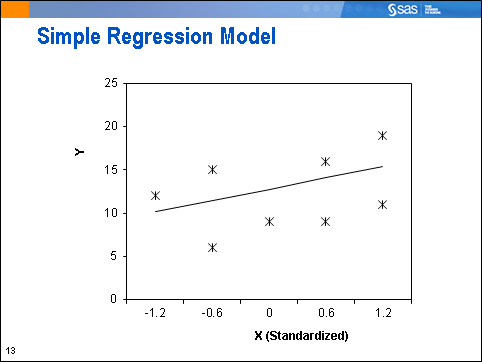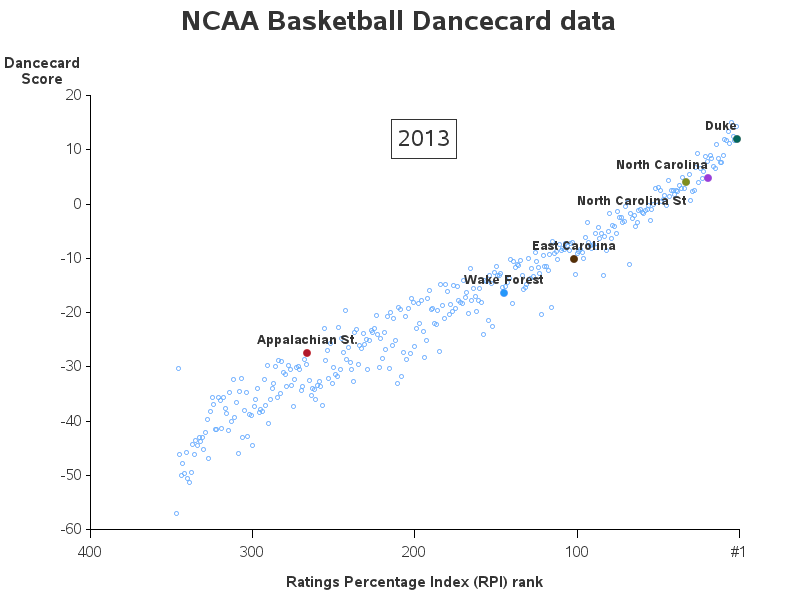
ODS graph styles provide users with an easy way to control things such as the colors and fonts used in a graph, freeing the user from having to specify these properties in their code. A lot of thought was given to picking colors that work well together, and look good. The
Uncategorized
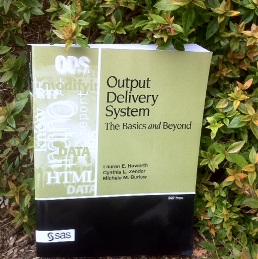
This week's SAS tip is from Lauren Haworth, Cynthia L. Zender, and Michele Burlew's book Output Delivery System: The Basics and Beyond. This example-driven book includes broad coverage of some of the best features of ODS. To learn more about the book and the authors, visit our Web catalog to read
To say that I'm excited about the SAS 9.4 release is an understatement! For example, did you know that in SAS 9.4, you can write SAS/Graph output directly to a Powerpoint slide?!? This is definitely an item that was on my "wish list," and will no doubt make life a
SAS 9.3 already has smooth (anti-aliased) lines in SAS/GRAPH device=png output, and in SAS 9.4 you will also get smooth lines in your device=gif output (and gif animations)! Woo-hoo!!! Here are a couple of simple examples to demonstrate: The first example is device=gif Proc Gmap output. If you look very closely, you'll notice that
Tried, tested and true -- I’m sure you already practice some, if not all, of these efficient techniques to save resources. I recently shared these 10 techniques with the Wisconsin Illinois SAS users group in Milwaukee. The conference ran smoothly under the incredibly able guidance of Dr. LeRoy Bessler. I’ll
This week's SAS tip is from Art Carpenter and his latest book Carpenter's Guide to Innovative SAS Techniques. Art is a talented SAS user and prolific author--and was just recognized in the SAS Circle of Excellence for 30 years of using SAS software. After taking a look at this week's book
This week's SAS tip is from Michele Burlew and her book SAS Macro Programming Made Easy, Second Edition. Michele is the author of several extremely helpful SAS books. Visit her author page to learn more about her work and for additional free content. The following excerpt is from SAS Press
This week's SAS tip is from Gerhard Svolba and his latest book Data Quality for Analytics Using SAS. For additional bonus book content and to learn more about Gerhard and his work, visit his author page. The following excerpt is from SAS Press author Gerhard Svolba's book "Data Quality for Analytics Using SAS"
They say "Imitation is the most sincere form of flattery"... Therefore when I imitate Hans Rosling's famous world-data animation, it's not that I'm jealous, but that I'm paying homage to him! (OK, and maybe also a little bit jealous! LOL) Well, anyway, for those of you who haven't seen it,
I probably shouldn’t admit this… When I first started learning the SAS programming language 15 years ago, I just couldn’t figure out how to easily create pretty, customized graphs and reports. So, I would prepare my data in SAS, then export to some other application to produce my results. I