Michele Ensor recently posted a wonderful blog with a graph of the 2014 Winter Olympics medal count. I'm going to further refine that graph, making it an Olympic graph ... on steroids! :) Here is Michele's graph: First, let's give it a few simple cosmetic changes. I always like to have
Uncategorized
I must admit, I’m glad the 2014 Winter Olympics are over. I’ve spent too many night-time hours glued to the TV. I can now get on with my life. But first, let’s have a little SAS fun with the medal standings. How do you prefer your summary of medal standings
One of the primary predictive modeling tools capable of fitting very complex nonlinear functions is Neural Networks (NN) in SAS advanced analytics software SAS Enterprise Miner (EM). The default option in NN EM node uses a Multilayer Perceptron model with an input, an output and a single hidden layer with
A student preparing for the Base Certification exam recently sent us a question, but it wasn’t about the exam. It was about how to position her certification credential on her resume to highlight she’s SAS Certified. This is a great question since employers continuously tell us a SAS Certification is
Does your middle-tier environment run optimally? Have you ever wondered how you can tune your environment to run more efficiently? The SAS 9.4 Web Applications: Tuning for Performance and Scalability document, which is available for download from the SAS Product Documentation page, is here to help. The Tuning for Performance
Teacher pay, and the possibility of a raise, has been a hot topic in North Carolina lately. So I decided to look around and see if I could find any good data related to teacher salary, and then try to determine the best way to present that data graphically. I found that
We get very little snow in Wake County, NC (SAS Headquarters) - therefore when we do have snow, it's a big deal and they close the schools. Which made me wonder ... how much snow does it take to close schools in the rest of the US? Last week we got our
This week's SAS tip is from Applied Data Mining for Forecasting Using SAS by Tim Rey, Arthur Kordon, and Chip Wells. Whether you're a forecasting practitioner, engineer, statistician, or economist, you'll appreciate the many real-world examples in the book. And hopefully this free excerpt. The following excerpt is from SAS Press
Even though I’ve worked as software technology marketer over the years, I have to admit that on a personal level I’ve probably related more to TV programming than software programming. When it comes to writing, I’ve always gravitated more toward crafting marketing communications than code. And when it comes to
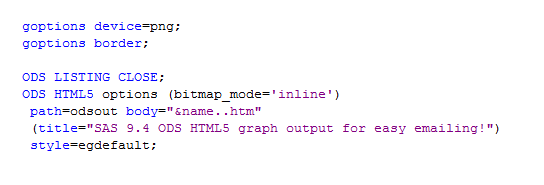
In a previous post, I showed you how to send graphs with charttips & drilldowns in an email ... but what if you also need to send the graphs that you're drilling-down to? You guessed it - SAS also has a slick trick for doing that! When you create SAS graphs