In this SAS tutorial video, you will learn how to explore the distribution of a variable using the UNIVARIATE procedure in SAS. You will also be introduced to a few of the options that can be used in PROC UNIVARIATE, and some UNIVARIATE output is highlighted and discussed. You
Uncategorized
It's time for another SAS tutorial video! In this video, you will learn to create a logistic regression model and interpret the results. You will learn PROC LOGISTIC syntax and how to interpret p-values, parameter estimates, and odd ratios. You can watch more SAS tutorials like these by visiting
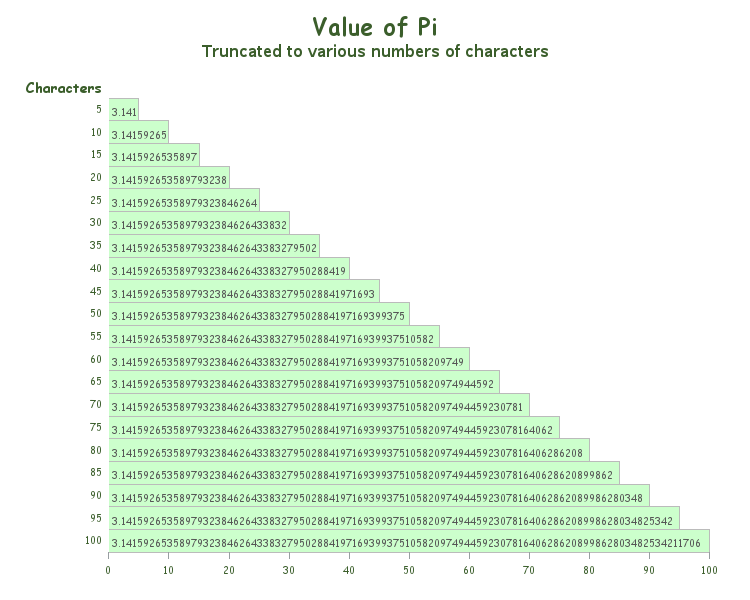
Did you know that this Friday is Pi Day? How are you planning to commemorate this special day? :) Next year's Pi Day might even be more special than usual, being that it will contain: March 14, 2015 - 9:26:53. And if you realize the coolness of that (3.141592653), you might be
In these two SAS tutorial videos, you will learn how to use the REG procedure to run a simple or multiple linear regression analysis. SAS Tutorial: Fit a Simple Linear Regression Model with SAS Learn how to use the REG procedure to run a simple linear regression analysis. In addition,
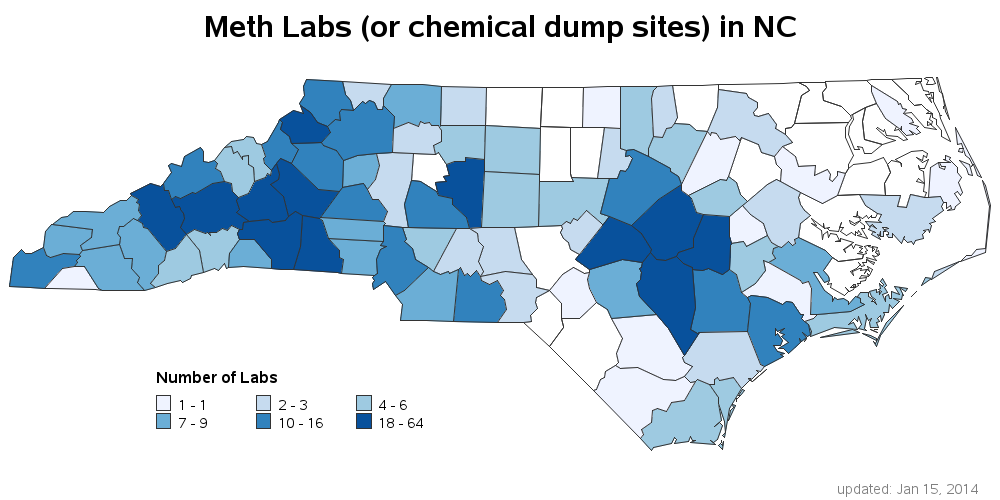
In the Breaking Bad TV series, Walter White has an impressive lab where he secretly makes the illegal drug methamphetamine (meth). Wouldn't it be cool to use SAS to show the locations of all the clandestine meth labs in the US?!? Let's do it!... In this blog, I show you

To build accurate predictive models you need clean data. Having a good understanding of the data helps you to interpret the models correctly and enables you to make sound intelligent business decisions. SAS Enterprise Miner can help you to achieve the twin goals of improving the quality of data and
In this SAS tutorial, you will learn to import data from Microsoft Excel into SAS with SAS/ACCESS Interface to PC Files. Learn to read any sheet or named range from an Excel workbook as a data set or import any sheet or named range to create a SAS data set
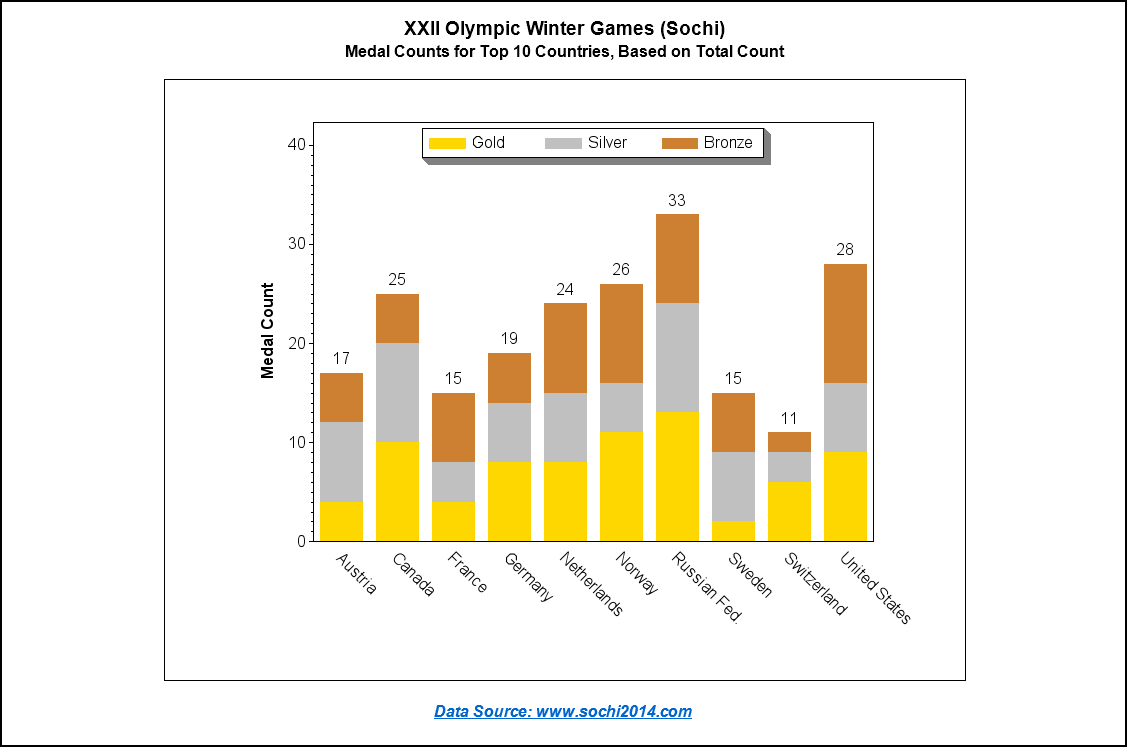
Michele Ensor recently posted a wonderful blog with a graph of the 2014 Winter Olympics medal count. I'm going to further refine that graph, making it an Olympic graph ... on steroids! :) Here is Michele's graph: First, let's give it a few simple cosmetic changes. I always like to have
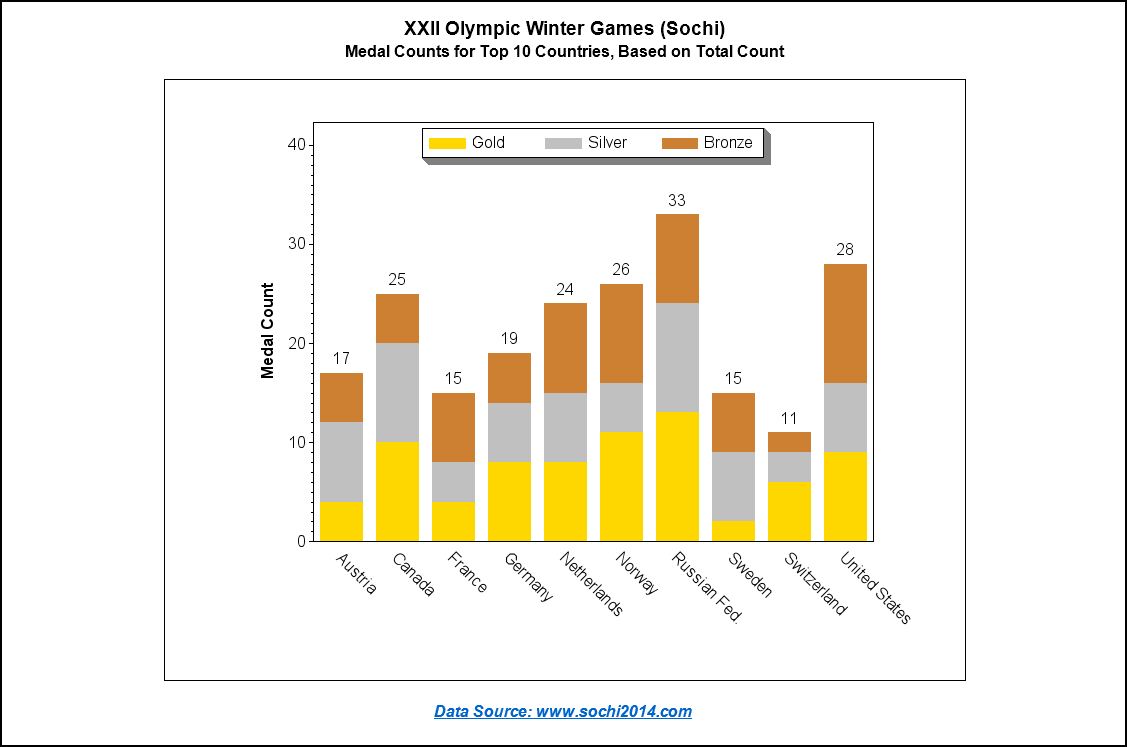
I must admit, I’m glad the 2014 Winter Olympics are over. I’ve spent too many night-time hours glued to the TV. I can now get on with my life. But first, let’s have a little SAS fun with the medal standings. How do you prefer your summary of medal standings
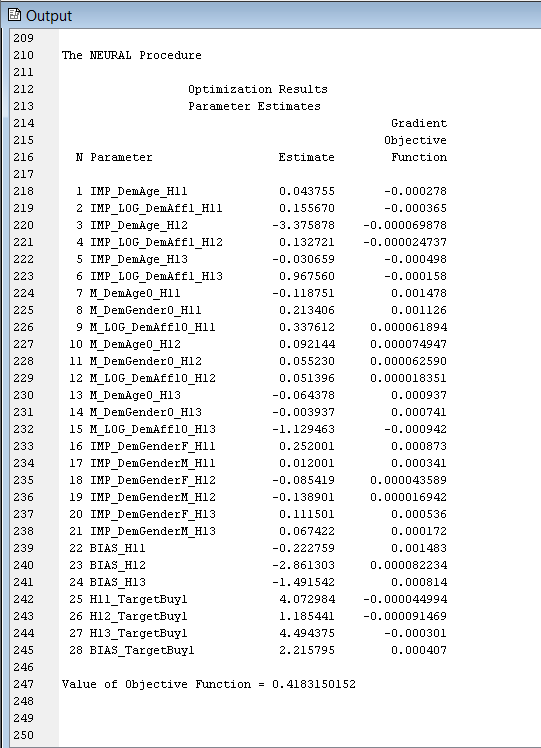
One of the primary predictive modeling tools capable of fitting very complex nonlinear functions is Neural Networks (NN) in SAS advanced analytics software SAS Enterprise Miner (EM). The default option in NN EM node uses a Multilayer Perceptron model with an input, an output and a single hidden layer with


