I attended the Scottish Highland Games this past weekend ... nearby in Scotland County, North Carolina! They put on a great event, with kilt-wearing Scotsmen throwing things, bands playing bagpipes, kids dancing, and clans sharing their family history. And to get into the mood for this event, I decided to
Author
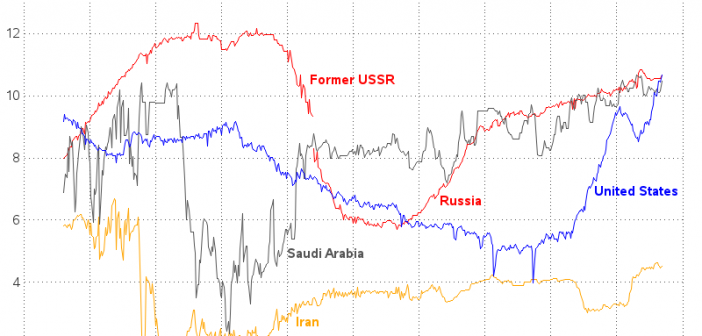
Over the years, the US has drilled for crude oil in several locations, such as Pennsylvania, Texas, Alaska, and the Gulf of Mexico. A few years ago, as the US started drilling more in North Dakota, there were forecasts that we would surpass Saudi Arabia in crude oil production. And recently,
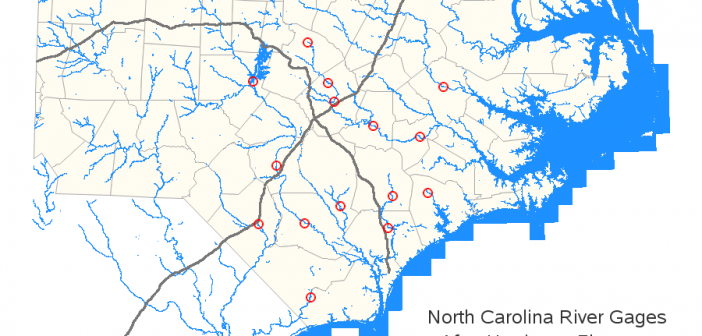
Here in North Carolina, a hurricane recently moved very slowly across our state, causing major flooding, and even closing miles of interstate highways for longer than a week. There is data available online for gauges along the river (or gages, as they call them), but I doubt many people know
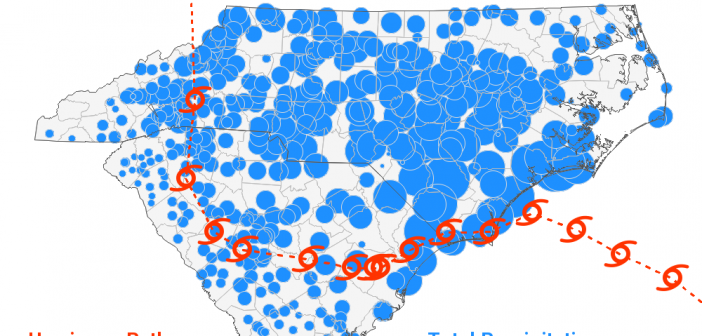
"We been through every kind of rain there is. Little bitty stingin' rain, and big ol' fat rain, rain that flew in sideways, and sometimes rain even seemed to come straight up from underneath." Was that a quote from the Forrest Gump movie, or something said regarding Hurricane Florence? Could be either one! Hurricane Florence recently came through
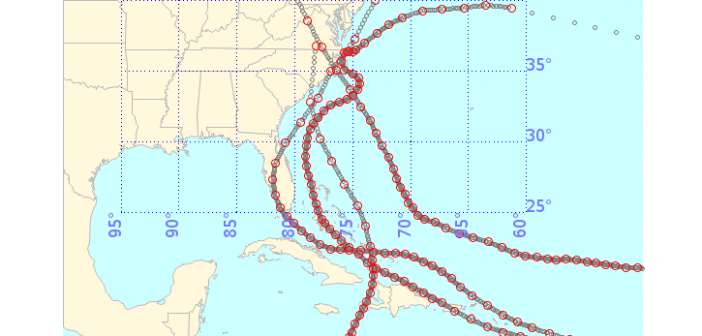
Here in North Carolina (NC), we're pretty much resigned to the fact that many of the hurricanes in the Atlantic Ocean are going to visit us. NC sticks out farther into the ocean than most of our neighboring states, and that just makes a tempting target for the hurricanes. But
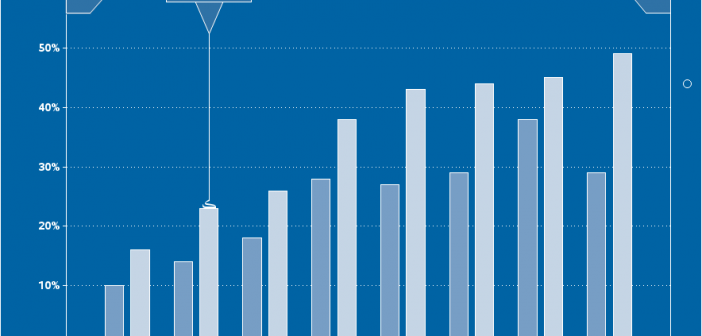
I usually create very technical graphs, that just focus on conveying the information in a concise and straightforward manner (no wasted colors, and nothing to distract you from the data). But sometimes, depending on your audience and the purpose of the graph, you might need to create a graph that
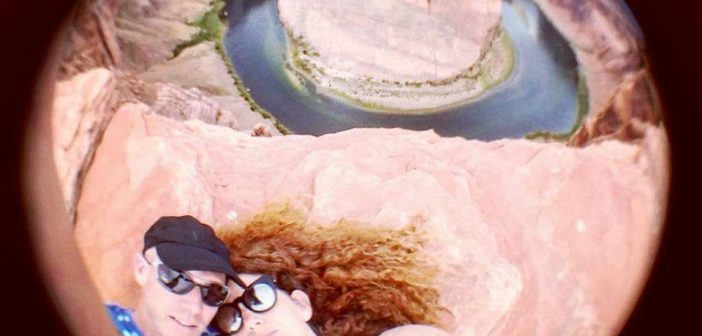
Many of the most beautiful areas in the US are owned by the government, to preserve them and allow access for everyone to enjoy them. And most US schools are traditionally closed during the summer, which provides families a great opportunity to go visit state and federal lands (parks, forests,
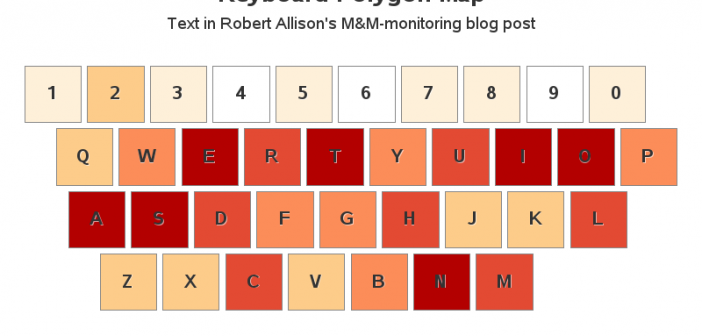
If you're good at games like Wheel of Fortune, Scrabble, or Words with Friends, you've probably figured out that certain letters appear more often than others. But do you have a cool way to figure out which letters appear most & least frequently? How about using a computer to plot
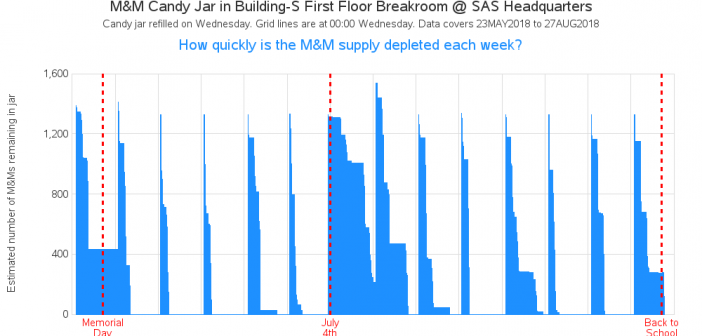
My buddy Chris recently blogged about accessing the IoT data from an M&M jar being monitored in one of the breakrooms at SAS. Now I'm going to take things a step further and analyze that data with some graphs. Grab a snack, and follow along, as we dig into this
Showing the most popular jobs in each state is interesting (as I showed in my previous two blogs 1, 2) ... but not that interesting. How about something a little more quirky?!? ... Let's determine the most disproportionately popular job in each state! Their Map I got the idea for