I recently took a trip to Scotland, to attend the Highland Games! (ok - that statement might be a tiny bit misleading) It was a very cool and interesting event, and I wondered where and when other such events might be happening. What better way to analyze this kind of
Author
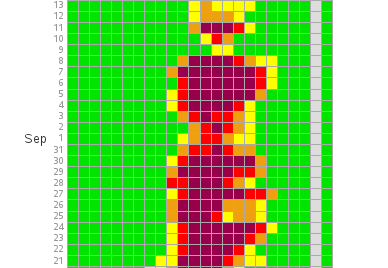
The movie Blade Runner came out about 30 years ago, portraying a dystopian future set in 2019 Los Angeles. Many of the technology predictions in the movie have actually become reality - but how about the weather and pollution? The movie was all about smog and a lack of sunshine, and I wondered
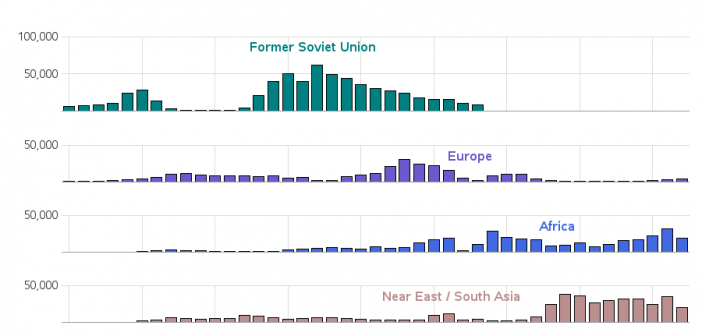
"Coming to America" - it's been the name of a funny movie and a dramatic song (can you name the actor & singer without cheating?!?) It's also been a dream for many, and an action for some. People have been coming to America both legally and illegally for many years, but there's one special category
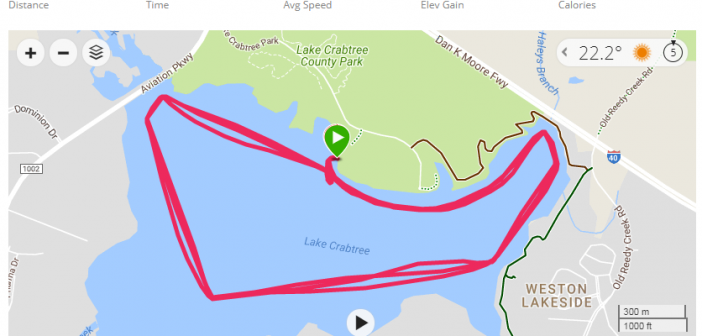
I recently paddled in a boat race, and was wondering how I did compared to all the other paddlers. And being a Graph Guy, I decided I should find a cool way to graph the data ... Here's some background information ... There's a great organization called Bridge II Sports
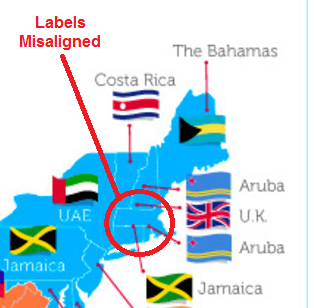
Orbitz recently published a map showing the most popular international travel destination for each of the 50 US states. It was an interesting map ... but of course, me being the Graph Guy, I had to pick it apart and create my own version. Follow along, and explore this interesting
Recent news reports indicate that the number of illegal immigrants apprehended along the US/Mexican border has dropped significantly since Trump took office. So, even though Trump hasn't had time to build a physical wall, perhaps there's a virtual wall in place now (built from the change in attitudes)? I've seen
How do the North American amusement parks compare in popularity? If this question was to come up during a lunch discussion, I bet someone would pull out their smartphone and go to Wikipedia for the answer. But is Wikipedia the definitive answer - how can we tell if Wikipedia is wrong?
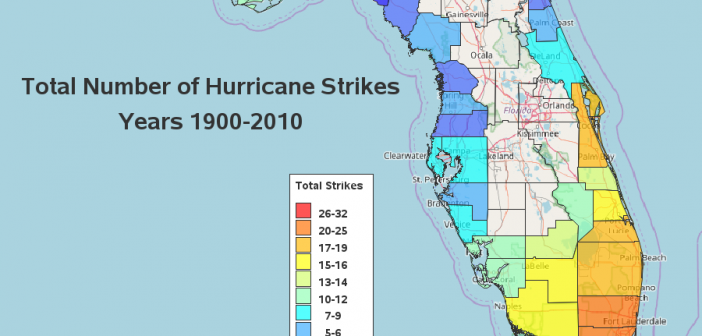
With Hurricane Irma recently pummeling pretty much the entire state of Florida, I got to wondering where past hurricanes have hit the state. Let's get some data, and figure out how to best analyze it using SAS software! I did a bit of web searching, and found the following map
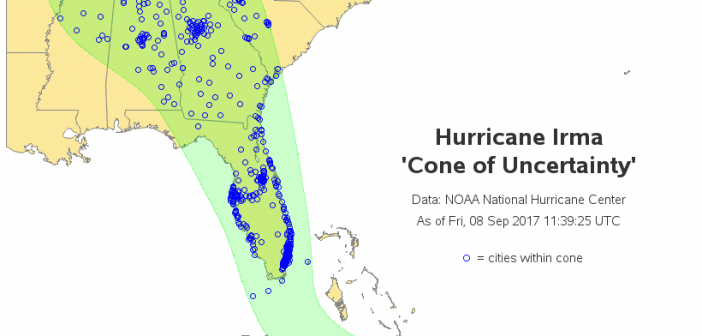
As Hurricane Irma makes its way through the Caribbean, and heads towards the United States, the big question on everyone's mind ... is the hurricane going to hit my city? Or, as some people like to say, "should I buy milk & bread?" Let's analyze & map some data to
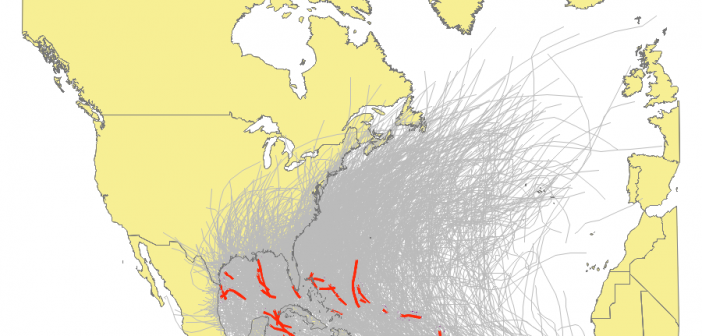
I suppose we've all been watching Hurricane Irma rip through the Caribbean like a giant buzzsaw blade, with wind speeds over 180mph. This is one of those rare Category 5 storms. But just how rare are Category 5 hurricanes? According to the Wikipedia page, hurricanes with wind speeds >=157mph are