In the aftermath of a natural disaster, most people want to help by donating supplies, money, etc. And then it becomes a matter of logistics - getting all those donations to the people who need them. We recently had several days of rain and flooding in North Carolina, and I was wondering if I could apply my visualization & mapping skills to possibly help out. Tag along as I show you the map I came up with ...
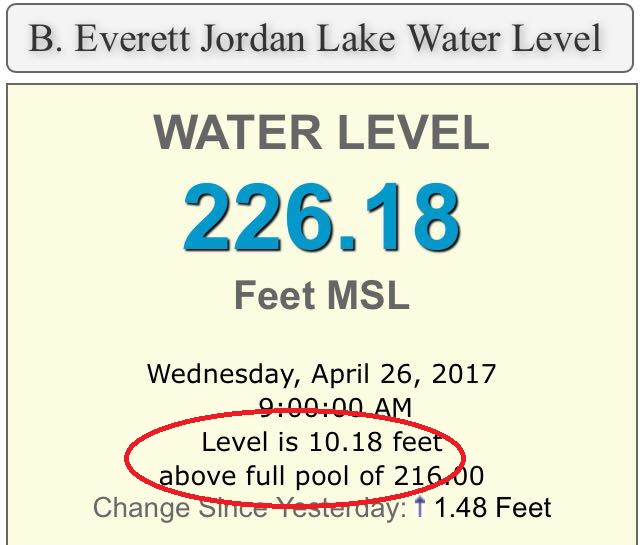
But before we get to the visualization stuff, here are a few pictures to get you thinking about the floods. In North Carolina, we have mountains, piedmont, and coastal plains. And whenever we have hurricanes or heavy rain for several days, many areas in the coastal plains experience flooding. In the early 1980s we opened Jordan Lake which is used to help control some of the flooding. While I'm writing this blog post, the level is up 10ft above normal - it's buffering a lot of water, but there was still a lot of flooding.
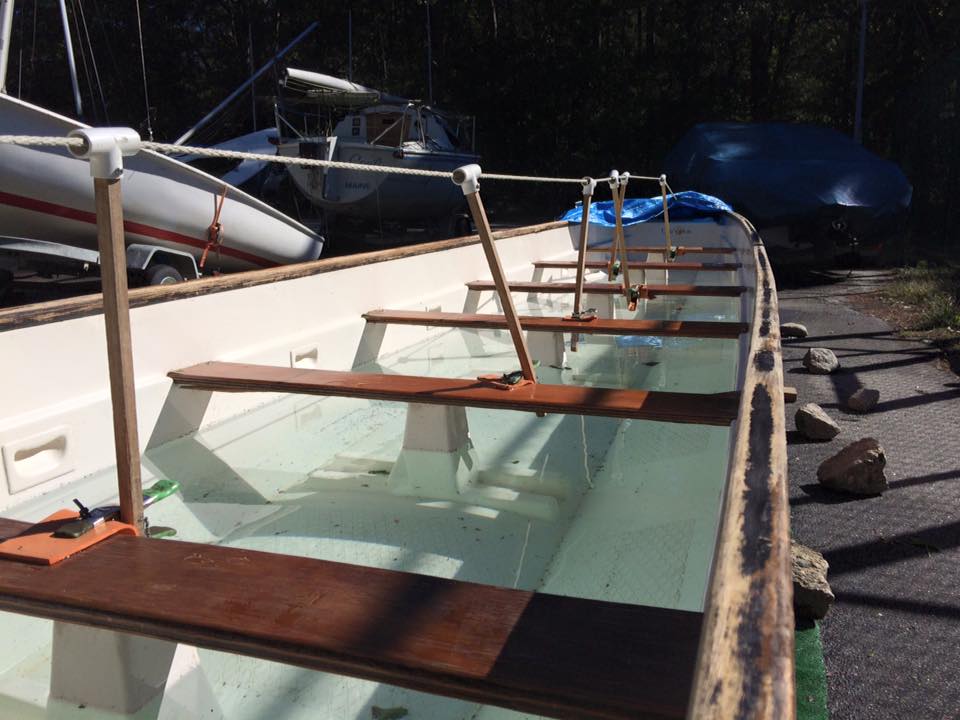
Yesterday, I went and emptied the water out of our team's dragon boat. The boat is about 43ft long, 4ft wide, and had about 1ft of water in it. That's about 172 cubic ft of water. There's about 7.5 gallons in a cubic foot, to that's about 1,290 gallons of water ... and at 8 pounds per gallon, that's over 10,000 pounds of water. In short, this just goes to show we got a lot of rain in the past few days!
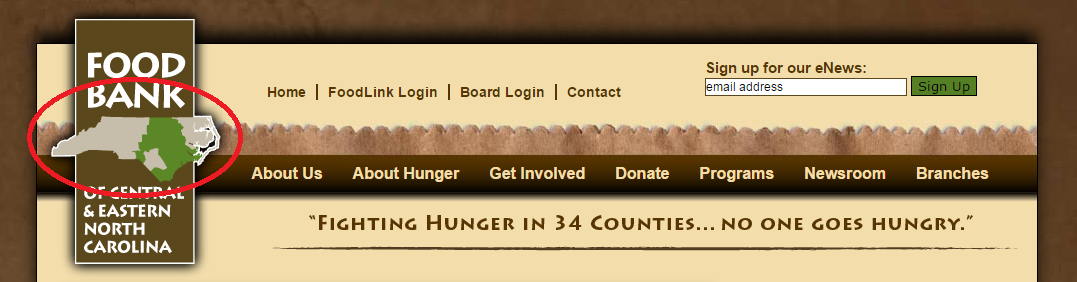
During a flood, many people are displaced from their houses, and lose all their possessions ... such as food. I knew we had some local food banks across our state, but I wasn't sure exactly where they were, and what areas they serviced. A Google search quickly turned up the Food Bank of Central & Eastern North Carolina website. It had a logo showing a map of NC, with the area they service shaded in green (which I've circled in red, in the screen capture below):
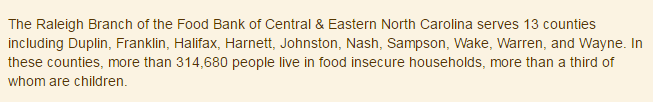
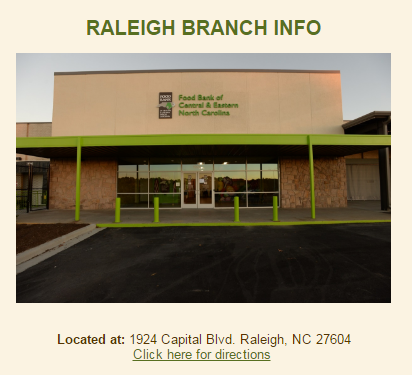
They also had a pull-down menu with links for each branch. The branch pages listed all the counties they served, and provided the street address of their distribution center. Here's the info for the Raleigh branch, for example. Can you quickly pinpoint in your "mental map" exactly where the distribution center is located, and the locations of the 13 counties it serves?
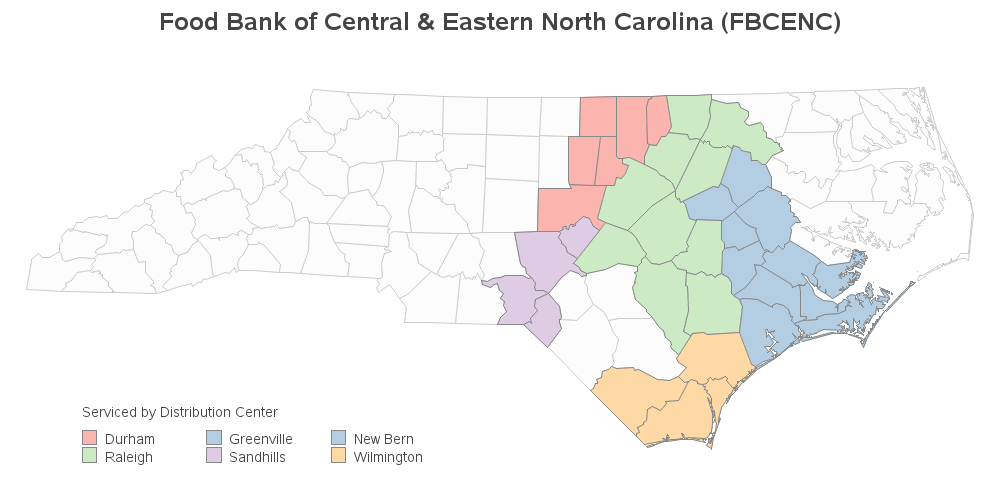
If you have as difficult a time as I do keeping track of the 100 counties in North Carolina, then you're probably thinking the same thing I'm thinking ... it sure would be nice to have a detailed map! So I built a dataset containing a list of all the counties they serve, and which distribution center serves which counties, and plotted that info on a SAS map. One slight 'oddity' - some of the counties are served by both the Greenville and New Bern branches, therefore I used the same color for counties served by either of those.
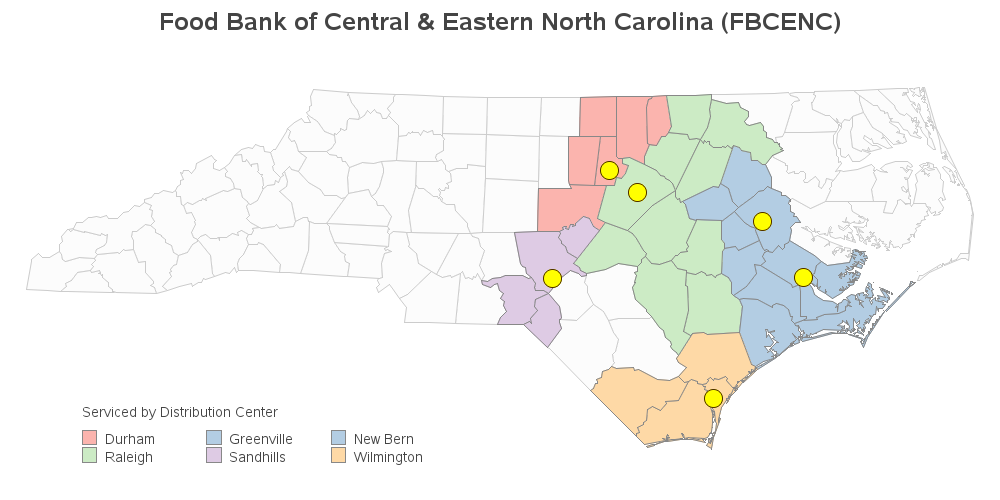
Next, I geocoded the addresses of the distribution centers, and plotted those as bright yellow markers on the map:
And for a final touch, I decided to try and show the reach of each distribution center, by drawing a line from the middle of each county to the distribution center(s) that provides for it.
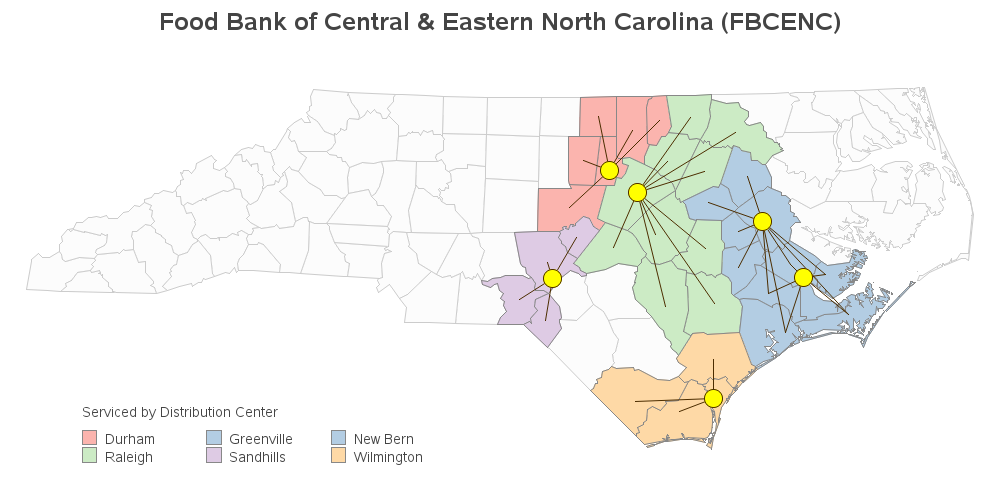
I think it's a pretty nice map, and conveys a lot of useful information! Perhaps people can use it to see which branch to donate to, to help certain counties. Perhaps we can identify counties that are a long distance from a distribution center, and recommend where to open additional centers.


2 Comments
That last map is a nice way to show networks. I did something similar a while back to show the perinatal network set up in New York state, what hospitals were linked to each of the regional perinatal care centers for care of mothers and newborns. Showing that at a statewide level meant that geocoding of hospital locations worked fine at the zip code centroid level.
Ahh - sounds like a nice use of SAS geocoding & maps!