The #1 rule of any self-respecting hipster is to not claim to be a hipster. Therefore, can there even be such a thing as a hipster beard, or hipster beard data? I contemplated this perplexing question, as I stroked my pirate beard. Since fashion trends tend to be cyclical, perhaps we can just look at beard trends in the past...
Luckily, I was able to find a wonderful study of facial hair trends from 1842-1972! Dwight Robinson went through all the old issues of The Illustrated London News, and counted how many times men appeared in the photos with various types of facial hair (beards, mustaches, sideburns, sideburns & mustaches, and clean shaven). He also created some great plots of the trends over time for each category of facial hair. But I wondered if there was a good way to visualize all the data in a single plot, and did a few Web searches to see if anyone had already worked on this.
Here is a screen capture of an example shown on the Plotly blog. The way the colored areas are stacked and arranged, it shows how the various facial hair trends phased in and out over time. The graph is a bit small, but you can click the edit chart link and see a full size version (although it takes a while to come up).
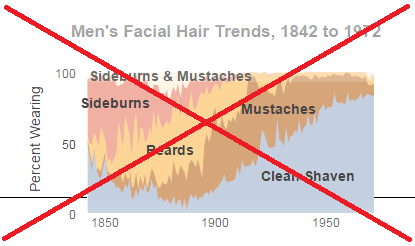
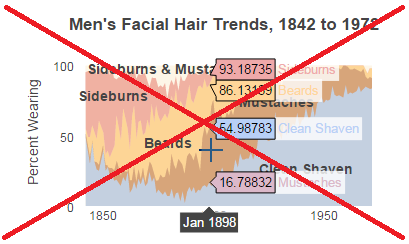
I like the layout of their graph, but that doesn't outweigh the other problems (mainly with the hover-text)... The time-axis hover-text is a bit deceptive -- it shows year and month values, but the source data makes no mention of month (therefore I think the month values they show cannot be correct). Also, when I scrutinize the hover-text values for the facial hair categories, they seem to be mislabeled (or outright wrong?) For example, look at the 'Clean Shaven' value of 54.98783% for 1898 -- it should actually be 16.5%. Their hover-text appears to maybe be showing the sum of all the values stacked under it, and also mislabeling the facial hair categories(?)
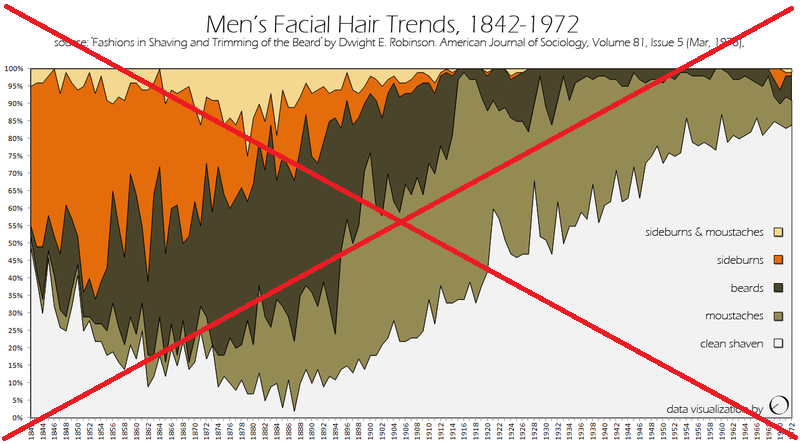
I found a similar graph in a vox.com article (they got it from an example on Reddit). This version is a bit bigger, but the axis tick mark labels are a bit too small to read. I also prefer labeling the areas (as they did in the previous graph) rather than using a color legend.
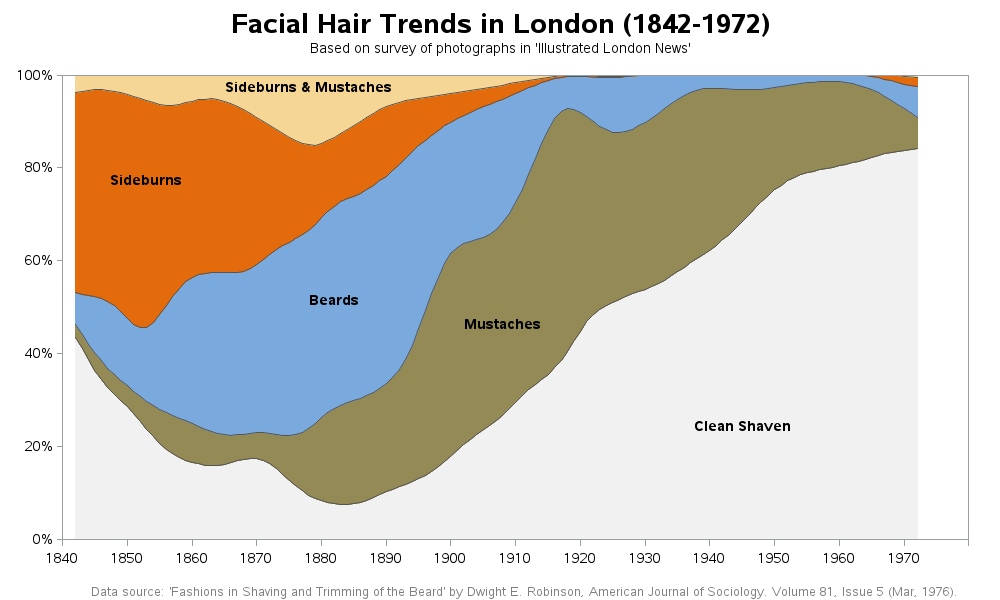
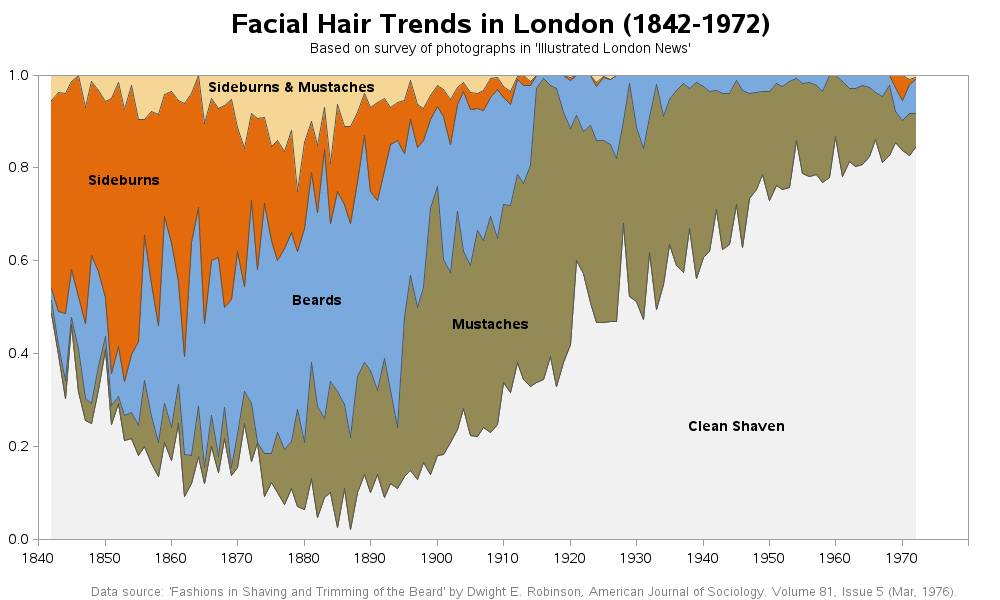
So I decided to create my own version(s) of the chart. First, I created a stacked area chart - a combination of the above two, using the best qualities of each:
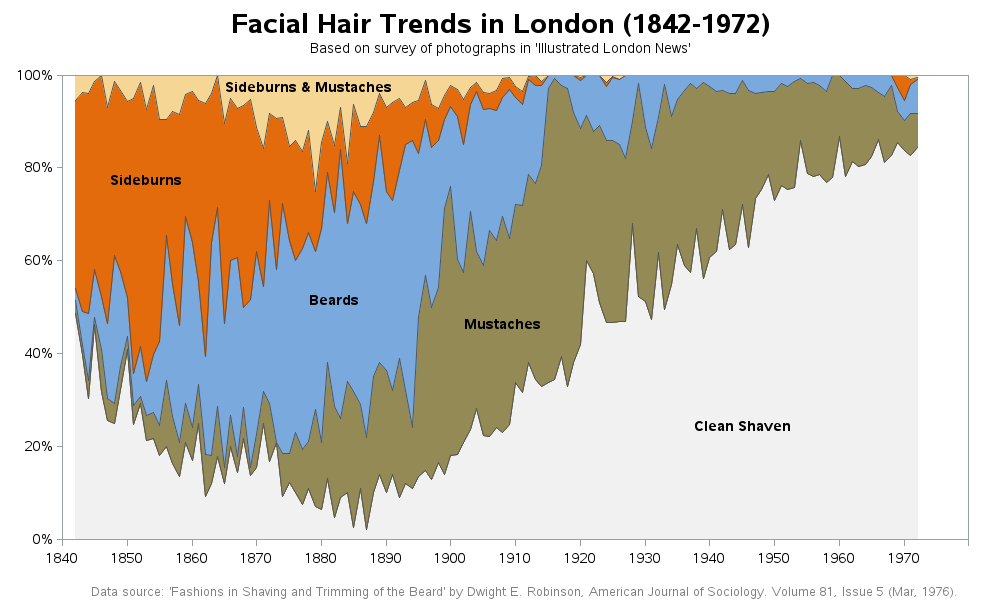
But there was still one thing that bugged me about the graph ... the jagginess. Of course the jaggies are following the actual data values, but I wondered if it might be better to smooth them out a bit(?) Therefore I used the Gplot symbol statement to specify a smoothed interpolation (i=sm30, rather than i=join), and came up with the following variation of the plot:
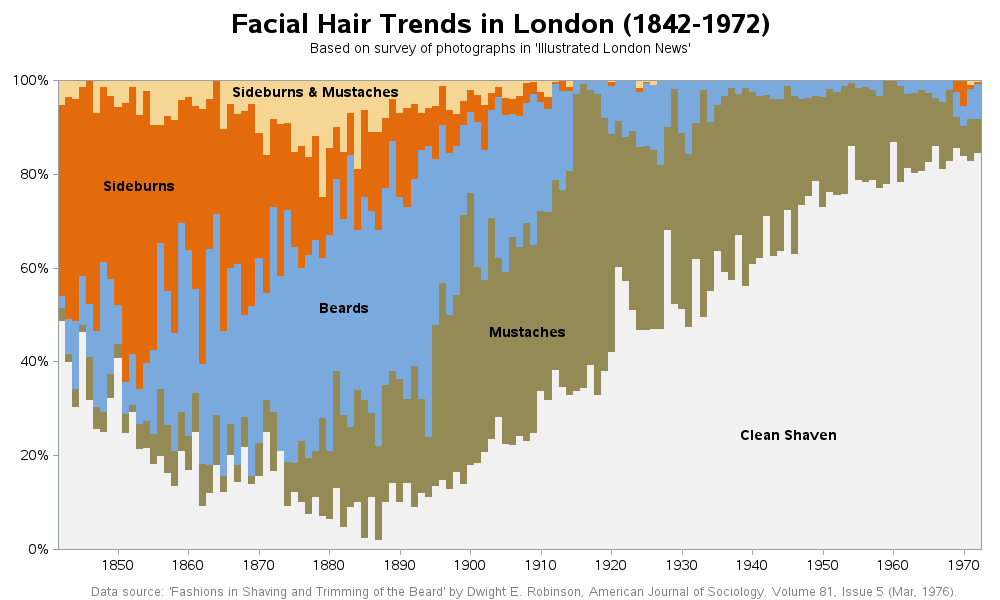
But I also wanted hover-text so I could see the actual values for each year. To get that, I would need to take a slightly different - a stacked bar chart. Each stacked bar segment represents a year and facial hair %, and I assign those exact values in the html hover-text. Click the image below to see the interactive version with the hover-text.
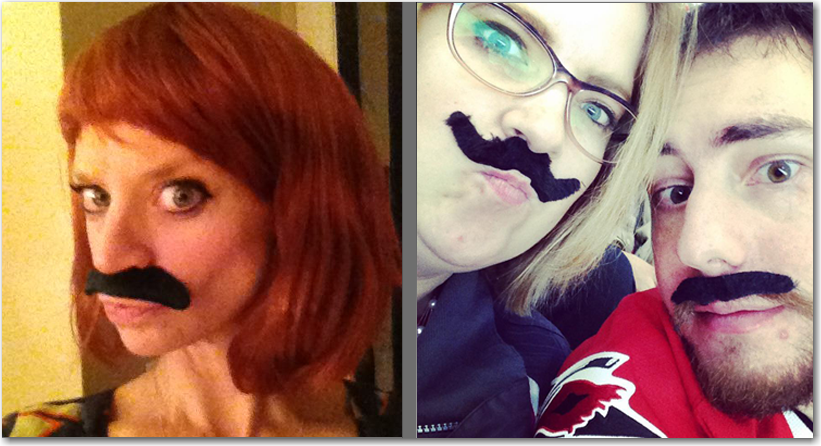
What do you think will be the next trend in facial hair?!? Using past trends to try to predict the future, would it be reasonable to assume that mustaches will be the next trend? ... If my Facebook friends (Jennifer, Jessica, and Jeremy) are any indication, this is a definite possibility!


