This week, I finally ate some liver, for the first time in over 20 years - and I realized it's a lot like prepping data (which I'll explain in this blog post). Here are a few of the similarities:
- They're both good for you.
- Thinking about them makes you go Eiwww!!!!
- You might dread doing them, but find "it's not so bad" once you start.
And to give you a mental image, here's a picture of my friend Becky's daughter with the "Eiwww Face" most kids make when thinking about eating liver (or prepping data) ...
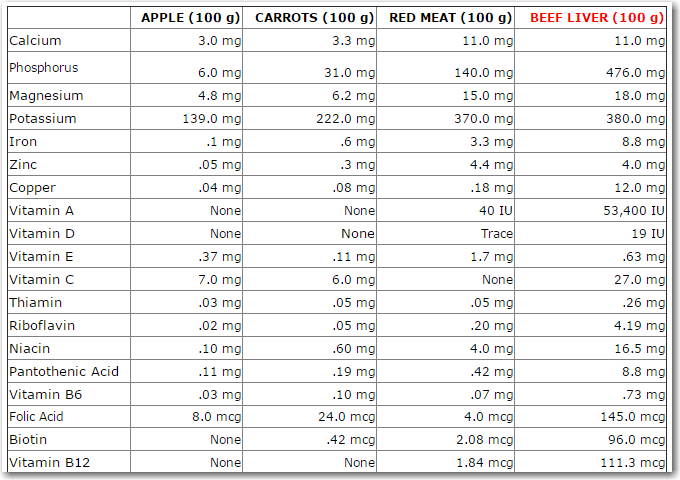
And now, back to this liver that I ate ... I knew it was "good for me" but being a data person I wanted to quantify "how good". So I did a few random Web searches, and found a page with this table of data comparing liver to several other foods.
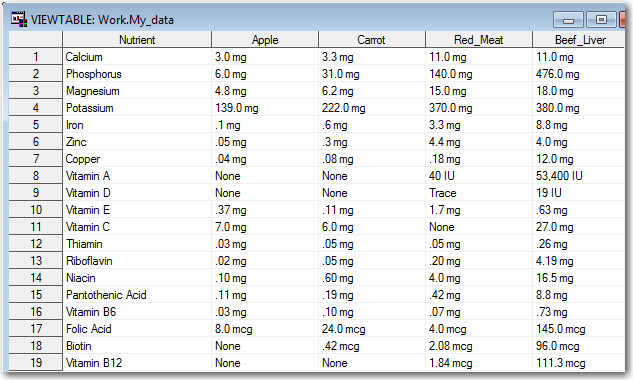
I copied-and-pasted the data into an Excel spreadsheet, and then imported it into a SAS dataset.
It imported easily, but the data wasn't suitable for my SAS analysis just yet - each food was in a separate column (variable), and I needed all the numeric values to be in the same column (variable) in order to plot them together in a bar chart. So here comes the data prep part - eiwww! I thought, "OK I'll just transpose the dataset," and naively tried the following code. But it yielded no observations in the output dataset:
proc transpose data=my_data out=my_data; by nutrient; run; |
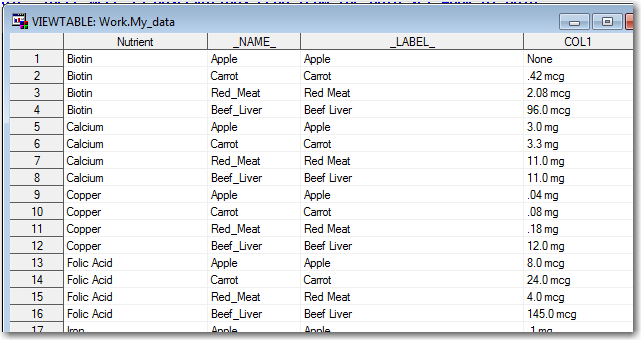
I scratched my head for a while, and then it occurred to me - "Ahh! Transpose is typically used on numeric values, but the values in this table are all character (since they have text units appended to the numbers)." Therefore I need to tell transpose exactly which of these character variables I want to transpose (in a 'var' statement).
proc transpose data=my_data out=my_data; by nutrient; var apple carrot red_meat beef_liver; run; |
Now I've got the data 'structured' correctly, but I need to do something to convert those text values into numeric ones, and record what units were used with each of them.
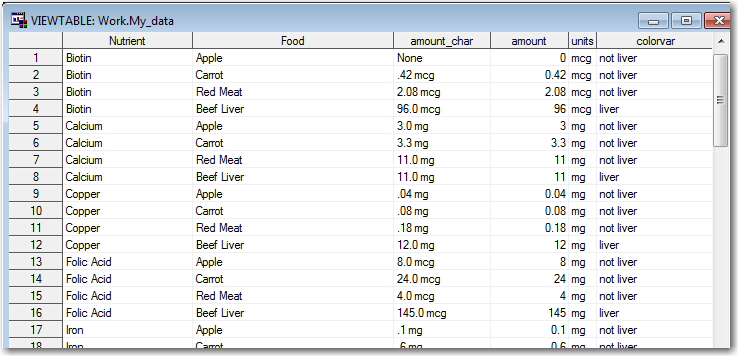
I used a data step to do all the remaining data prep work. I renamed the variables to make them more mnemonic, parsed out the numeric part of the values and stored it in a numeric variable (amount), assigned a text variable to store the units used for each nutrient, and created a variable to flag whether or not the food is liver so that I can color the liver bars differently in the bar chart.
data my_data; set my_data (rename=(_label_=Food col1=amount_char) drop=_name_); amount=.; if amount_char='None' then amount=0; else if amount_char='Trace' then amount=.000001; else amount=input(scan(amount_char,1,' '),comma8.2); length units $3; if nutrient='Biotin' then units='mcg'; if nutrient='Calcium' then units='mg'; if nutrient='Copper' then units='mg'; if nutrient='Folic Acid' then units='mg'; if nutrient='Iron' then units='mg'; if nutrient='Magnesium' then units='mg'; if nutrient='Niacin' then units='mg'; if nutrient='Pantothenic Acid' then units='mg'; if nutrient='Phosphorus' then units='mg'; if nutrient='Potassium' then units='mg'; if nutrient='Riboflavin' then units='mg'; if nutrient='Thiamin' then units='mg'; if nutrient='Vitamin A' then units='IU'; if nutrient='Vitamin B12' then units='mcg'; if nutrient='Vitamin B6' then units='mg'; if nutrient='Vitamin C' then units='mg'; if nutrient='Vitamin D' then units='IU'; if nutrient='Vitamin E' then units='mg'; if nutrient='Zinc' then units='mg'; length colorvar $20; if food='Beef Liver' then colorvar='liver'; else colorvar='not liver'; run; |
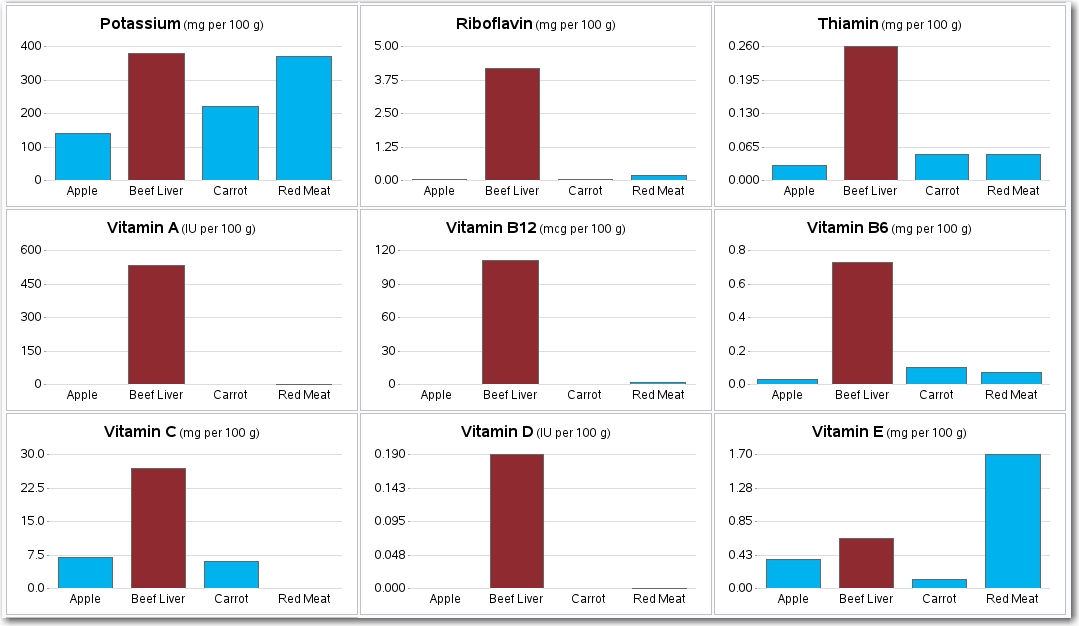
And now, with all the data prep done, plotting the data becomes a simple matter of doing my usual 'wibbly wobbly graphy waffy' stuff! Here is a screen-capture of a few of the charts (click to see all 19 them).
So, what's your favorite super-healthy food? And how does it stack up against liver? :)




13 Comments
Pardon me for being picky but the code would be a lot shorter (and safer) if written
Units = Scan( col1 , -1 );
The 'none' could be handled with an If statement.
I hope that you had onions and gravy with the liver.
What if there's a missing space in the amount_char between the number and the unit? For example, 0.4mg in stead of 0.4 mg.
That would make it a bit more difficult to parse - luckily all the values in this table had a space between the number and the units. :)
It's not too hard to parse just the value from 12.34xx
amount= inputn( amount_char!!'x', 'comma', anyAlpha( amount_char)-1) ;
The INPUTN function allows the length to be supplied by a variable which here is derived at the position before the first alphabetic character.
Concating letter x ( !!'x' ) ensures valid results when amount_char contains no letters.
Love it! Check this out next time you want to enjoy the benefits of liver (and some other super foods). http://blogs.sas.com/content/efs/2014/04/23/uncommon-super-foods/
you lost me when you mentioned "eating liver"......
Fortunately, you don't have to eat liver, to be a great data analyst! :)
When I look at the table I can see that some of the liver nutrient figures are considerably higher but it's the graphs that give me the 'it sure is' feedback. Love the graphy waffy stuff! :-)
I think I'm going to change my business card from "The graph guy" to "I do graphy waffy stuff"! :)
I will be cooking liver and onions next week! I also will use the 'wibbly wobbly graphy waffy' stuff!
That's great news - on both counts!
Nice graphics but sorry, I don't eat sewage treatment facilities
Hmm ... perhaps a consideration. But, of course, the water you drink has probably also been through a sewage treatment facility! ;)