"It's a floor wax, and a dessert topping" - this pretty much describes SAS/Graph! (bonus points if you know where this quote came from!)
Some people think of SAS as just a quality control tool. Others think of it as just a sales & marketing tool. And yet others think of it as just a forecasting tool. But really - where can you use SAS graphs along your business pipeline? ... Everywhere!!!
Out of my thousands of SAS/Graph examples, I've pulled together a collection of 52 examples that show how you might use SAS at every point along your business pipeline -- from choosing a business to go into, to measuring your customers' satisfaction after all is said and done.
I loosely group these examples into the following categories:
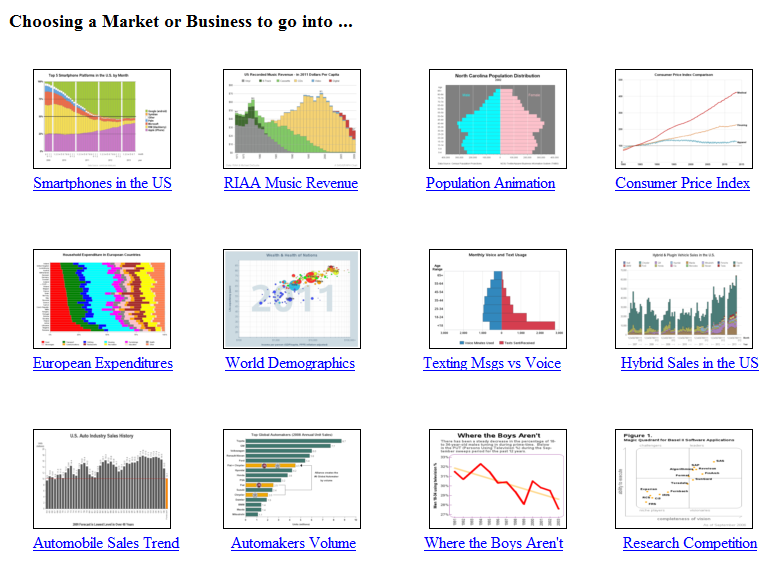
- Choosing a Market or Business to go into
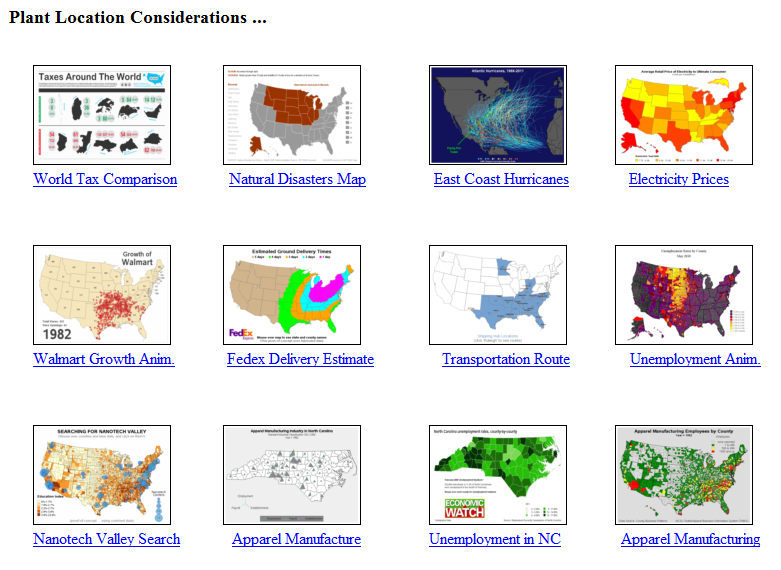
- Plant Location Considerations
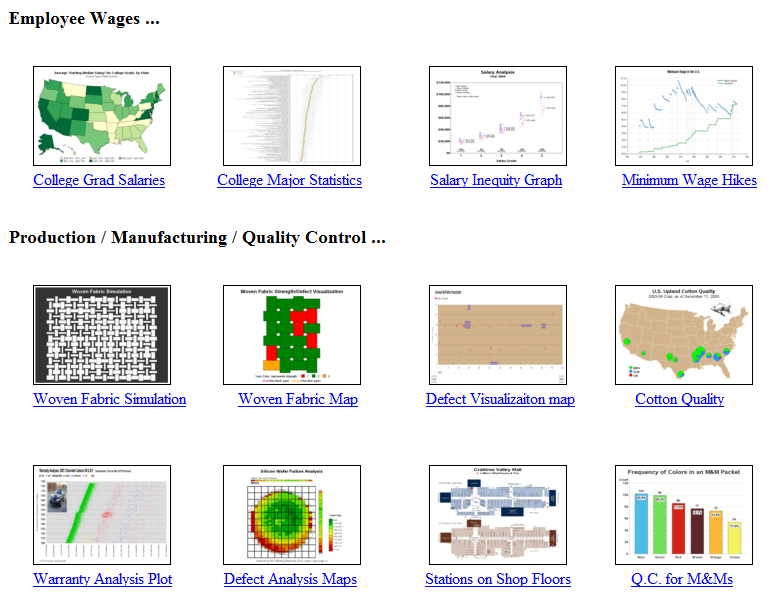
- Employee Wages
- Production / Manufacturing / Quality Control
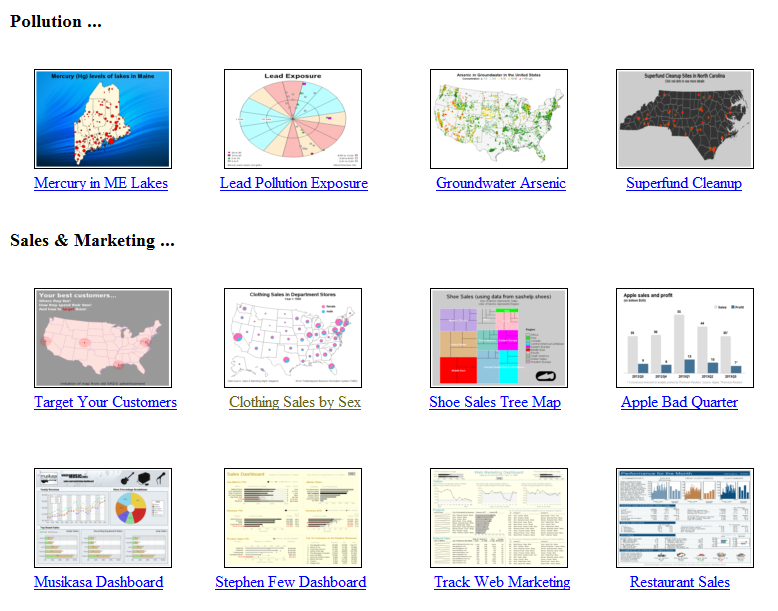
- Pollution
- Sales & Marketing
- Customer Satisfaction
It would be difficult for you to view the detailed full-size graphs in the blog, therefore I show thumbnails here, and you can click to drill down to the samples page to view them in full size (and download the SAS code).
Enjoy!...
What else do you use SAS graphs for in your business? -- Feel free to share in a comment!


6 Comments
very impressiv!
Thanks! - Hopefully you'll be able to re-use these examples, improve them, and make them even *more* impressive! :)
yeah, i went through your blogs and *collected* a few lovely ideas for my work :) they are indeed very encouraging for a beginner like me, just like the advertisement says *nothing is impossible*. Looking forward to more posts from you :)
Excellent! ... I predict you will soon be a SAS/Graph expert, and posting your examples on blogs in the not-too-distant future! :)
Nice demonstration.
LeRoy Bessler
Thanks!