ODS Graphics have matured. With SAS 9.2, GTL and SG procedures were a new direction for creating analytical graphs in SAS. The motivation and design of the GTL framework and the SG procedures was driven primarily by the needs of the procedure writers within SAS to enable the automatic creation of sophisticated graphs from procedures.
GTL and especially the SG procedures can be used by SAS end users directly to create many graphs in the Clinical and Health and Life Sciences domain. Certain complex graphs needed some creative coding. With SAS 9.3, it is now "easy" to create such graphs. This transformation has occurred with the help of your comments and our internal consumption of our own software (eating our own dog food).
Let us look at some examples.
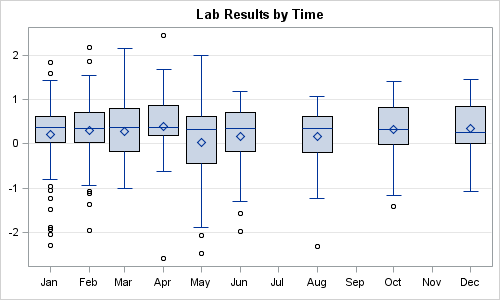
Box Plot of Lab Results over Time (Scaled Axis):
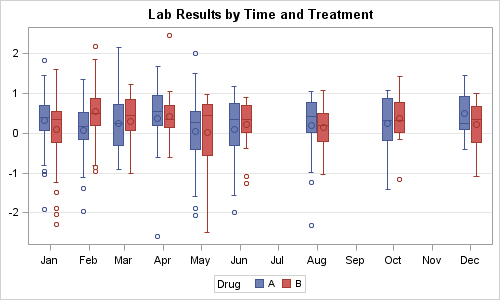
Box Plot of Lab Results over Time by Treatment:
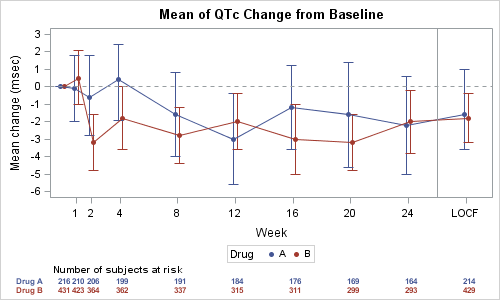
Mean of QTc Change from Baseline with "At Risk" table:
And, for the uses who need a little more "flash" in their graph, we have something for you too.
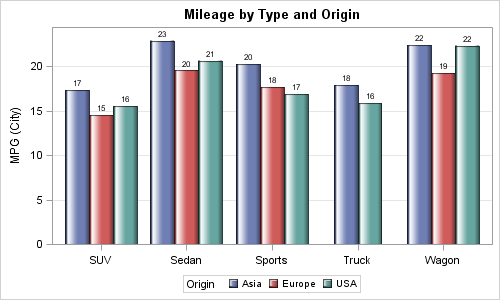
Cluster Grouped Bar Chart of Mileage by Type and Origin with Data Skins:
With SAS 9.3, these graphs are easy to create, directly using the data with just a few lines of code.
At SAS Global Forum 2012, there will be many opportunities to learn about these new feature and to share your views.
- I will present the new SAS 9.3 features in a one day pre-SGF "developer led" seminar. The course will also cover the basics of using SG procedures and GTL.
- I will present a Hands-On session on getting Quick Results with ODS Graphics Designer, an interactive application for creating graphs. Using this application, you can create many graphs with no knowledge of graph syntax.
- Prashant Hebbar will present a paper on how you can use GTL in ways beyond the original intent to create graphs.
- Dan Heath, Prashant Hebbar and I will be available throughout the day at the Data Visualization station in the Demo area. Stop by and share your experiences and pains so we can improve the software.
- We will presenting SUPER DEMOs on various topics relating to graphs including:
- Clinical Graphs using SAS ODS Graphics on Monday and Tuesday at 2:00 in the Demo area.
- New SAS 9.3 features in SG Procedures.
- New SAS 9.3 features in GTL.
As we say down here, see y'all at SAS Global Forum 2012 soon.


4 Comments
@Sanjay and Chris,
you just convinced me: indeed just a few statements.
Regards Han
If it is really so easy and 'just a few lines of code' why not include those lines?
Now I could wonder if they are really produced by SAS 9.3 ;)
Han
Han, you can see examples of all of these and more, with code, at Sanjay and Dan's "Graphically Speaking" blog.
See examples of SAS 9.3 and SAS 9.2 graphs (including the full code) in Graphically Speaking.