Most analytics stories don’t start with technology. They start with a moment of friction.
A meeting where two dashboards disagree.
A decision that feels urgent, but the data arrives too late.
A report that technically answers a question but doesn’t inspire confidence.
That’s usually when organizations realize they don’t just need analytics, they need analytics that are fast, intuitive and trusted across the business. Analytics that people understand and actually use.
That’s the space SAS® Visual Analytics was built to fill.
As data volumes grow and AI becomes part of everyday decision-making, analytics can’t stay locked inside technical teams. It has to become something that business users engage with directly. It has to be fast, intuitive and explainable. And it has to connect naturally to the broader analytics life cycle.
That’s why SAS Visual Analytics plays such a central role in SAS® Viya®. It’s not just where the results are shown. It’s where insight becomes real.
This blog post kicks off our “SAS Visual Analytics: latest and greatest” series. Before we dive into specific innovations and new capabilities, it’s worth stepping back and answering a simpler question: what role does SAS Visual Analytics really play in modern analytics?
Not “what features does it have?”
But “what problem does it solve?"
From data to decision, without friction
At its core, SAS Visual Analytics is about reducing the distance between a question and an answer. It combines interactive visualization, automated insights and self-service reporting so that users can move fluidly from curiosity to clarity.
Built natively on SAS Viya’s cloud-enabled architecture, it’s designed to handle large volumes of data with in-memory processing, scalability and governance. This means users can explore freely, while IT and data teams maintain trust, security and consistency.
It’s analytics that feels fast and flexible, without sacrificing rigor.
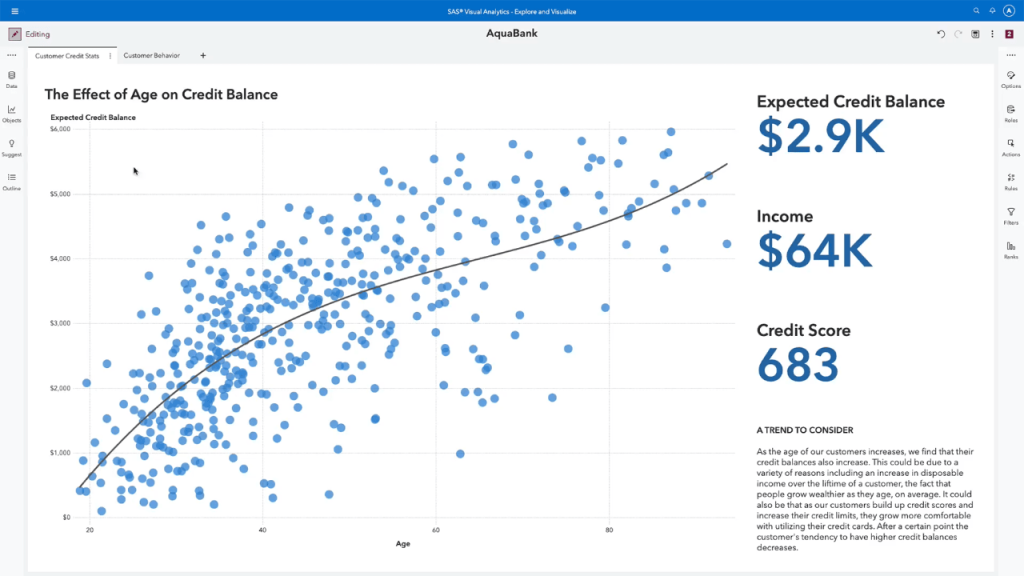
Explore: letting the data tell its story
The most powerful insights often start with exploration. SAS Visual Analytics makes that process intuitive and surprisingly fast.
AI-powered augmented analytics surfaces patterns, trends and outliers that might otherwise go unnoticed. Instead of manually testing endless hypotheses, users are guided toward what matters most. Automated storytelling and natural language explanations help translate complex behavior into clear insight, turning charts into narratives that people can understand and act on.
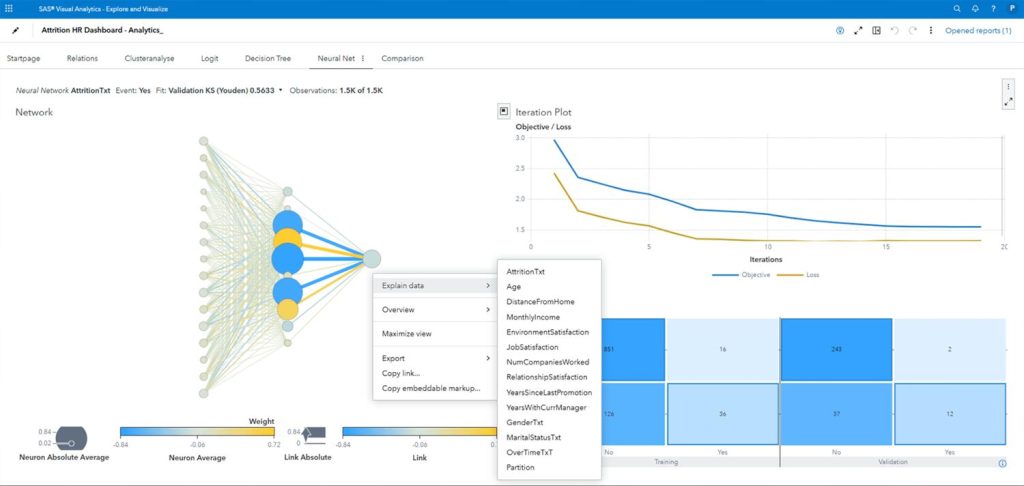
Analyze: advanced analytics without complexity
Exploration naturally leads to deeper questions. What happens next? What if conditions change? Which outcome is most likely?
SAS Visual Analytics brings advanced analytics into that same visual, interactive environment. Forecasting, goal seeking, scenario analysis and decision trees become tools anyone can use, no matter what your skill level is. The platform has built-in intelligence that empowers users to uncover patterns, test assumptions and explore outcomes using advanced analytics presented through intuitive, interactive visuals.
As a result, teams can confidently evaluate options, anticipate future trends and make data-driven decisions faster and more effectively.
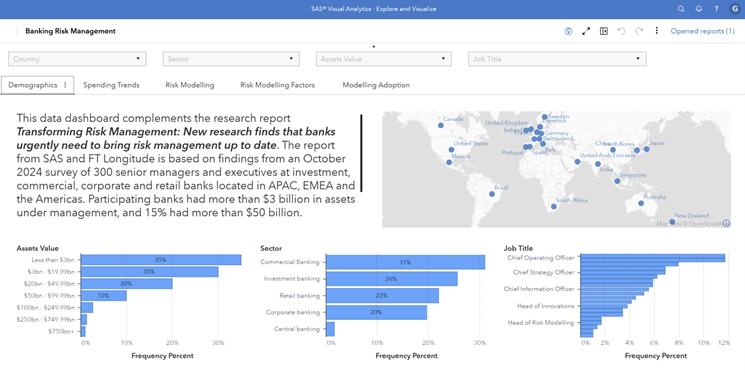
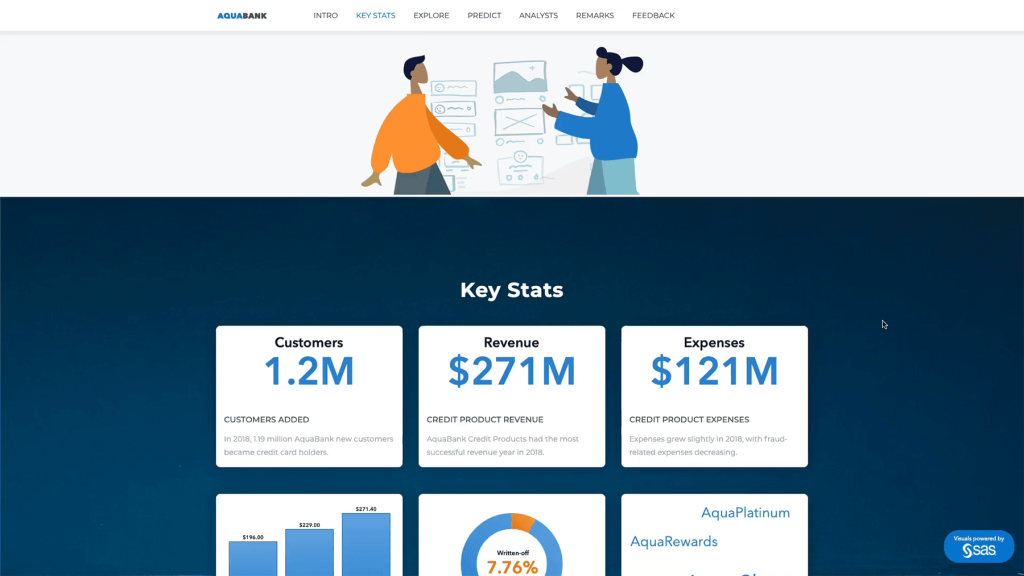
Visualize: clarity that travels
Visualization is where insight becomes shareable. Interactive dashboards and reports make complex information easier to grasp and easier to discuss. Geo analytics adds spatial context that can completely change how trends are understood. And because content works seamlessly across web and mobile, insights travel wherever decisions happen.
Executives get clarity. Teams get alignment. And analytics becomes part of the daily business rhythm.
Collaborate: insights are only valuable if they are shared
Analytics doesn’t create value in isolation. It creates value when people act on it together.
SAS Visual Analytics makes collaboration simple.
Reports and dashboards can be shared instantly, directly with colleagues or teams – wherever they are. The mobile app enables exploration on the go. And integration with Microsoft 365 lets insights live naturally in Excel, PowerPoint, Word and Outlook.
Instead of exporting analytics into static files, the analytics stay alive in everyday workflows.

Integrate: analytics wherever your business needs it
Modern analytics can’t stay confined to a single interface. SAS Visual Analytics is designed to travel.
With support for third-party JavaScript libraries such as D3 and C3, REST APIs, and the SAS Viya SDK, organizations can embed powerful visual analytics directly into custom web applications.
Insights can appear in customer portals, operational systems, or digital products, extending analytics beyond dashboards into real-world action.
A foundation within the SAS Viya ecosystem
SAS Visual Analytics doesn’t live in isolation. It’s tightly integrated into the broader SAS Viya platform, working alongside:
- SAS Visual Statistics for deeper statistical analysis.
- SAS Model Studio for advanced modeling.
- SAS Data Preparation for data readiness.
- Open-source integrations (Python, R, SQL).
This integration lets insights created in one area of Viya to be reused, visualized and operationalized across the platform.
Who it’s built for
SAS Visual Analytics succeeds because it serves many audiences without fragmenting the experience:
- Business analysts gain self-service exploration and faster insight.
- Executives gain clear, trusted dashboards for decision-making.
- Data scientists and analytics teams gain a visualization layer that brings advanced work to life.
- IT and governance Teams gain centralized control with enterprise security.
Why this matters now
Analytics is evolving. It’s no longer just about reporting on the past. It’s about shaping what happens next. Platforms like SAS Visual Analytics are foundational because they make advanced analytics accessible, collaborative and actionable at scale.
This is the baseline. Everything that follows builds on it.
What’s next?
This overview sets the stage, but it’s just the beginning. In the next blog post, we’ll take a deeper dive into one of the most talked-about innovations in SAS Visual Analytics: SAS Viya Copilot for Augmented Analytics and how AI is reshaping the analytics experience.