Industries including sports and entertainment, travel, manufacturing, education and government benefit from analytical insights
In the United States and other parts of the world, there are signs. Record automobile traffic. Surging demand for workers. And a continued push to vaccinate. The pandemic and its effects are still very much with us, but life seems to be returning to normal, or more precisely, a “new normal.”
As organizations across industries deal with this altered landscape, analytics technologies like artificial intelligence (AI) and machine learning are helping them adjust quickly, align resources and better meet the evolving needs of their customers.
Here are five industries using analytics to move to a new normal:
Sports and Entertainment
This year’s Summer Olympic Games in Tokyo were different than others. Because of Covid concerns, this year’s Games were held without spectators.
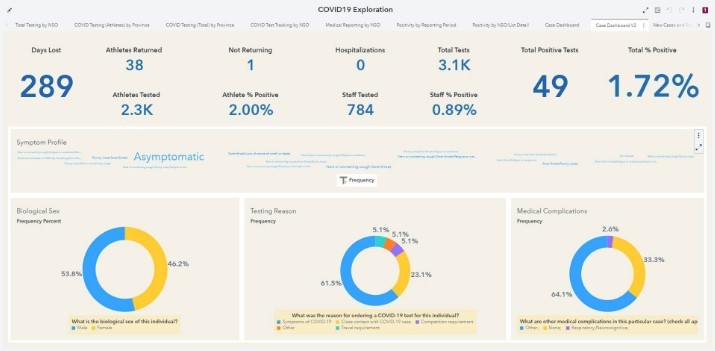
The Canadian Olympic Committee, working with its official analytics partner SAS, used advanced analytics leading up to the Games, both to help its athletes optimize training to reach the medal podium, but also to train safely during the pandemic.
Coaches and the Canadian Olympic Committee medical team continue to rely on SAS Viya and its AI and machine learning capabilities to assess training processes, identify at-risk sports, and recommend precautions.
With a dashboard powered by data visualization, coaches track athletes’ performance. In the months before the Games, the coaches also helped Canadian Team members return to their sport after a positive COVID-19 test or potential exposure.
With AI and machine learning at its heart, the SAS platform helped Canadian Olympic Committee coaches and athletes re-calibrate when training disruptions occurred. Coaches could then make strategic adjustments to the routines of athletes recovering from illness or facing lost training days.
Travel & Hospitality
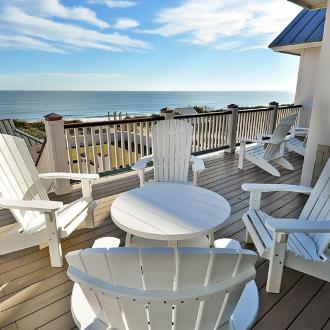
During the pandemic, people did still take vacations, though in the US many of those trips were by car and to nearby destinations. With its pristine beaches and laid-back lifestyle, the Outer Banks of North Carolina has remained a tourist magnet.
Even after the summer travel season, Americans still take road trips and book long-delayed family vacations.
For Twiddy & Company, a family-run company that manages more than 1,000 rental vacation properties on the northern Outer Banks, one key to its success has been analytics.
Twiddy & Company uses SAS Analytics to provide home management and maintenance on behalf of owners while ensuring repeat visits from rental guests.
And Twiddy & Company has seen record booking of its managed properties over the last two years – including the 2020 peak COVID-19 year – and the data points to another record season this year.
Using analytics, the company can forecast and streamline the management of routine services, such as cleaning hot tubs and pools before guests arrive for vacation.
Twiddy & Company relies on remarkably specific home-pricing information generated through SAS to compete in the Outer Banks rental market with other local firms and large international companies like HomeAway and Airbnb.
“What we deliver is hospitality – that's our passion and our business,” says President Clark Twiddy. “SAS has helped us, through better data analytics, to deliver it with a higher degree of confidence.”
Manufacturing
WaterRower, a US-based fitness equipment manufacturer was concerned with how to manage the health and safety of its employees at work during the pandemic. When gyms and workout studios were closed, coupled with more Americans working from home, demand rose for its rowing machines. But increasing its workforce without implementing advanced safety measures was simply not an option. The solution: Peter King, CEO of WaterRower, decided to work with SAS, implementing SAS AI capabilities to help WaterRower employees safely return to the workplace.
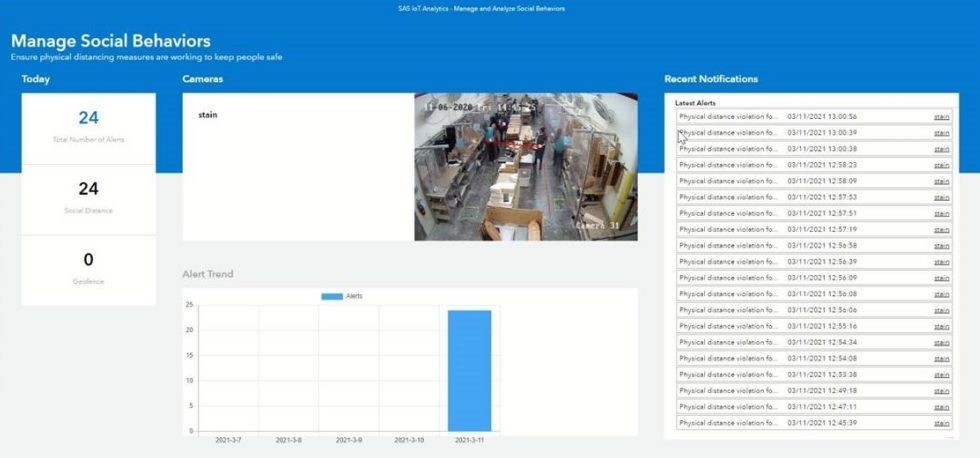
SAS and partner SuperMicro developed and deployed a computer vision system for WaterRower that monitors physical distance.
The SAS powered physical distance monitoring solution consists of a real-time dashboard, an alert system, and a post-facto dashboard to monitor compliance with physical-distancing and crowd-density guidelines. Existing security camera footage from WaterRower was used to train the model, and all employee data was anonymized.
The real-time dashboard consisted of a front page displaying the activities of employees. It also included a summary of total violations and an email alert system.
The results: WaterRower’s team of engineers and manufacturing leaders continuously reviewed the SAS AI-powered dashboard and alert system. By implementing strategic changes to work areas, employee workflow and internal movement paths, WaterRower achieved record production volume while significantly reducing cases of close contact within its manufacturing facilities.
Education
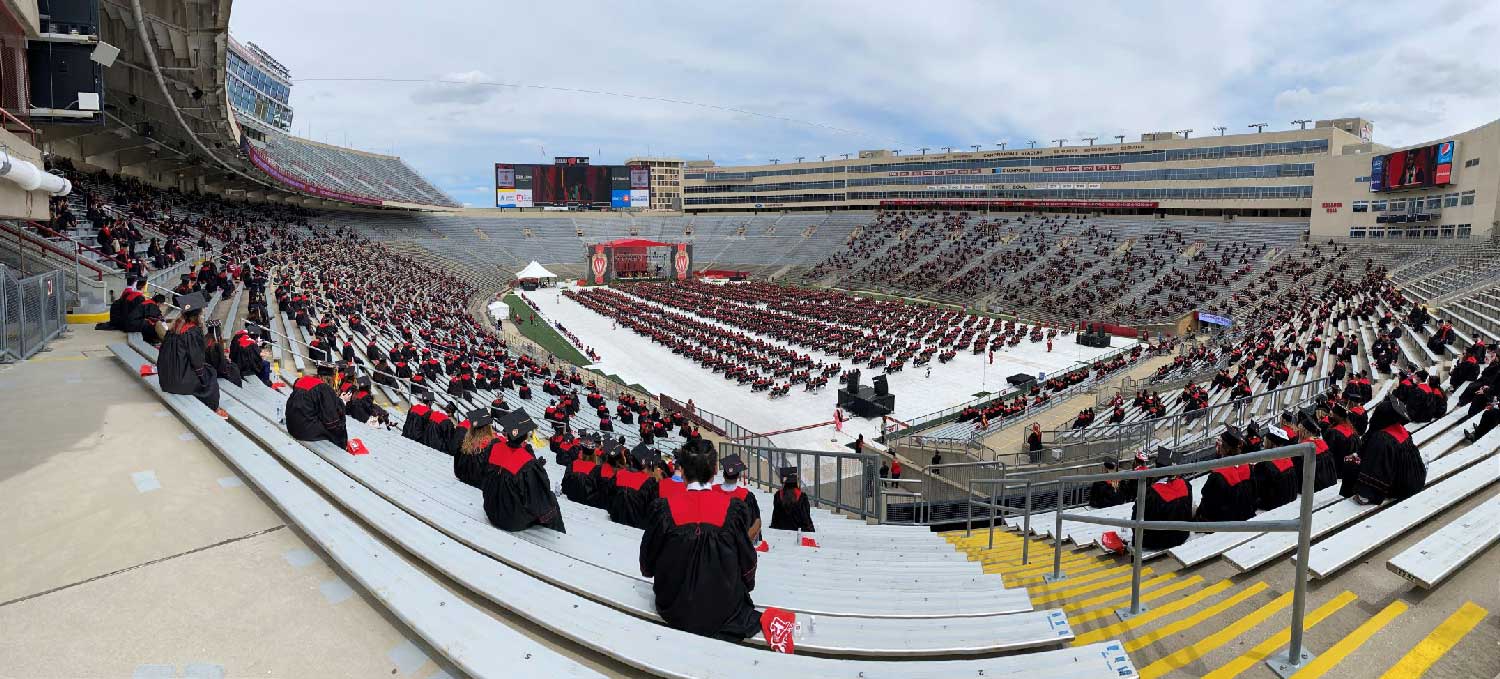
As stadiums, arenas and other venues welcome back in-person events, venue optimization software can help optimize attendance and create a safer fan experience. For the University of Wisconsin-Madison, helping its graduates attend their graduation/commencement ceremony was an important goal.
The University’s Department of Athletics used SAS to determine socially distanced seating layouts for recent commencement ceremonies at Camp Randall Stadium. This home to the Wisconsin Badgers football team has a normal capacity of 80,321 people.
“An in-person commencement was an important milestone for our university. Creating a memorable experience while supporting the safety of our graduates, faculty and operations staff required significant flexibility and planning,” said Daron Jones, Wisconsin Athletics Director of External Engagement. “SAS was the right partner to work with on this venue seating optimization effort. They collaborated with us step-by-step while tailoring a comprehensive seating optimization plan specific to all of the unique aspects of Camp Randall Stadium, and completed the project in a short amount of time.”
SAS for venue optimization uses models and data visualization to provide an ideal seating layout based on a set of ticketing and social distancing parameters and objectives. Wisconsin’s two ceremonies, one for undergraduates and another for graduate degree candidates, were limited to participants only. However, even in a venue as large as Camp Randall Stadium, it was a challenge to accommodate graduates while allowing for six feet of social distancing.
Potential ceremony participants were sent seating request surveys to identify groups who wanted to sit together. The SAS venue optimization models factored in the survey results and pandemic rules and restrictions.
Data visualization showed the Wisconsin athletic department what the stadium seating arrangements would look like on graduation day. The athletic department easily uploaded the venue optimization results into its ticketing system for fulfillment.
Government
While there is continued talk of a “new normal,” especially in the United States, variants of COVID-19 mean that many countries are still grappling with rising infections, complex vaccine rollouts and in some cases shortages of these vaccines and other critical supplies.
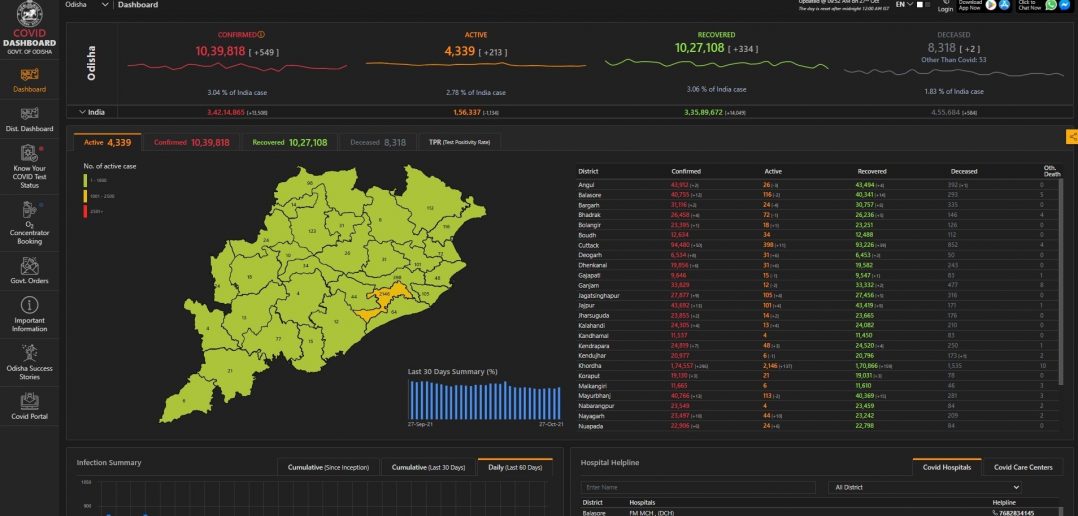
India is one such country. Its eastern state of Odisha, on the Bay of Bengal, is home to more than 46 million people. That’s more than in the state of California, the most populous US state.
The Government of Odisha has turned to an advanced analytics and visualization platform powered by SAS Viya to create a public COVID-19 dashboard.
Odisha’s citizens and government officials proactively use the Odisha State COVID-19 dashboard as the single, trusted source for tracking trends in infection rates, hospitalizations and available medical resources.
Using this platform, high volumes of data on citizen registrations, contact tracing, health conditions and quarantine compliance are aggregated, transformed and processed to generate insights.
In addition to rich visualizations, this data has been successfully used in forecasting peak infection times and modeling the optimal infrastructure augmentation and distribution by the State. In essence, the dashboard has enabled Odisha to stay ahead of the virus and save lives.