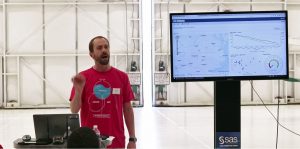
What do you get when you combine analytics, aviation and the Internet of Things? A learning experience that leaves everyone flying high!
At Data on the Fly, 25 area high school students had the opportunity to learn how technology has changed – and continues to change – the aviation industry. The day began with a tour of the air traffic control tower at RDU International Airport. Students then gathered at the DOT hangar to hear about the day’s agenda and meet the team of volunteers who would walk them through the project.
Presenters from SAS, the Department of Transportation and the NC Science Festival shared their excitement about analytics and aviation, and it wasn’t long before the student teams were each digging into a small box of parts they’d been provided with. The final product was a Stratux aircraft monitoring device, which was assembled from a Raspberry Pi computer board, software radios and antennae.
The Stratux boxes were placed on the tarmac and immediately began receiving data from aircraft in the area. Information such as aircraft speed and altitude was bounced down and displayed on each team’s iPad via an app called Foreflight, and the teams were able to see their work come to life with the power of SAS Visual Analytics.
Volunteers show passion for aviation and analytics
Karen Allen Lee, Senior Director of Internal Communications at SAS, pulled together volunteers from SAS to help organize the event, which she says couldn’t have happened without a great team effort. Senior Director of R&D Don Koch and Principal Implementation Project Manager John McNeill, both amateur pilots, were excited to participate.
“I’ve been around aviation as a hobby and information technology as a profession since well before these students were born,” McNeill said. “This event allowed me to bring the two together in a way that hopefully inspires them to consider a career that incorporates both.”

Alongside Lee, Koch and McNeill, SAS had five other employees volunteering as team leaders.
“I have a personal interest in both aviation and evangelizing STEM to students, and this event was a perfect combination of the two,” said Senior Manager of Software Development Michelle Proctor, one of the volunteers. “I especially liked seeing the light bulb go off for a young woman in my group. It’s moments like these that make every second of volunteering worthwhile.”
Another volunteer, Senior Associate Implementation Project Manager and student pilot Vatslav Orlov, said. “It was enjoyable to watch the students’ curiosity bloom throughout the event with an increasing amount of great questions. The variety of fun activities will likely make a lifelong impact on how they view the world of data and aviation, showcasing the power of science and how two different disciplines can be intertwined with one another.”
It’s impossible to predict where the next great innovator might be hiding. But programs like Data on the Fly help spark an interest in STEM in young people. With a little luck, one of the 25 students who participated in the event might be inspired to study aeronautical engineering, or simply to think about a career that marries analytics and aviation. The sky really is the limit.
“Today we were able to provide an opportunity for high school students to have a hands-on experience with technology around IoT, big data and the power of analytics,” Lee said. “They gained a broad knowledge of how aviation data plays a big role in getting an aircraft to its destination, and how the FAA uses that data to help make critical decisions. And being that North Carolina was ‘First in Flight,’ an aviation-related project just seemed like a natural fit.”

5 Comments
As a private pilot and SAS user of 14 years, I would be very interested in the Visual Analytics results that the students got to see from this demo. Is there a way to get that?
I will include a sample of the data collected at the Data on the Fly event and upload it to a blog. I can share the link as soon as it is released.
Hi Arun,
We are working on away to share the technical aspects of this project. Stay tuned.
Thanks,
Don
Any update on this?
We added the data to our K- 12 repository, Data Depot. You need to register with your email account to access the data and it takes a few minutes to download due to file size but it’s all there. https://www.curriculumpathways.com/portal/Launch?id=3001&sourceid=1237