English

Analytics | Data Visualization
Rick Wicklin 0
Create biplots in SAS

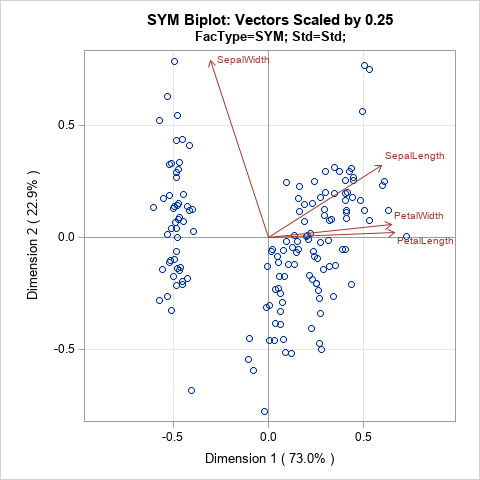
Biplots are two-dimensional plots that help to visualize relationships in high dimensional data. A previous article discusses how to interpret biplots for continuous variables. The biplot projects observations and variables onto the span of the first two principal components. The observations are plotted as markers; the variables are plotted as

Work & Life at SAS
Lisa Allred 0
When Parents Disagree

This is an issue I hear about from parents all of the time.  Sometimes the disagreements are small, and sometimes they are very significant.  As your child ages, the stakes become even higher when parents can't get on the same page.  Here are a few common ways that parents find themselves

1 993 994 995 996 997 3,148