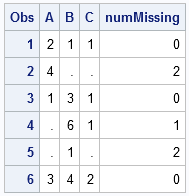
In this blog we have been discussing graphs useful for analysis of data for many domains such as clinical research, forecasting and more. SG Procedures and GTL are particularly suited for these use cases. So, when I came upon a dashboard image from Steven Few's Visual Business Intelligence blog, showing the
English
Dashboard graphs
Friday's Innovation Inspiration - Prevalence data analysis
When I read the way that this user is working with SAS, I took a look around support.sas.com to find examples to allow you to work with your own data. (Take a look at this.) If this example isn't quite right for you, plug in your own key words.
Convert a covariance matrix to a correlation matrix in SAS
I have previously blogged about how to convert a covariance matrix into a correlation matrix in SAS (and the other way around). However, I still get questions about it, perhaps because my previous post demonstrated more than one way to accomplish each transformation. To eliminate all confusion, the following SAS/IML