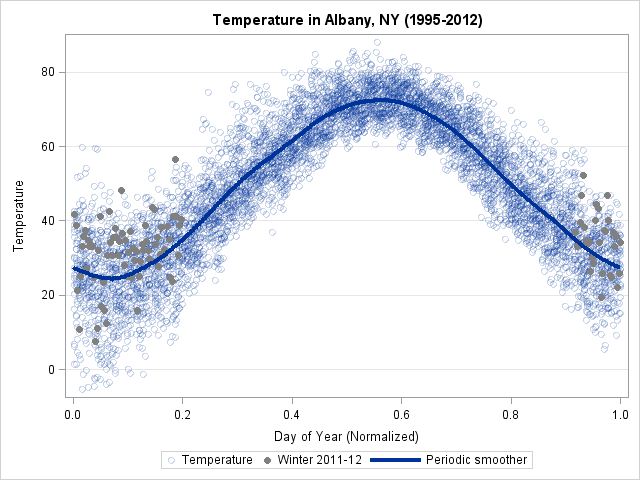
Creating a periodic smoother

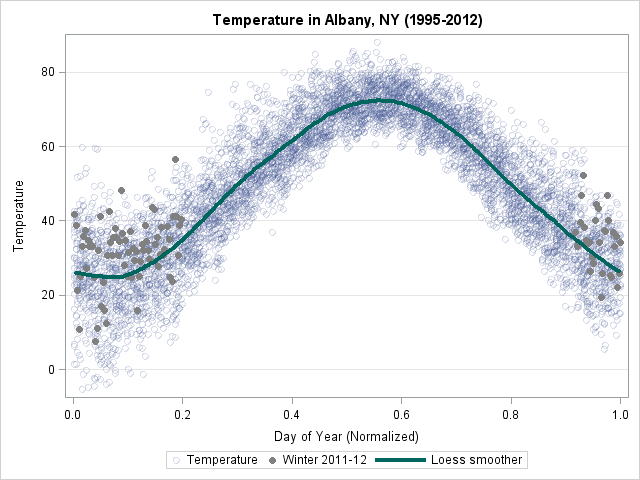
In yesterday's post, I discussed a "quick and dirty" method to smooth periodic data. However, after I smoothed the data I remarked that the smoother itself was not exactly periodic. At the end points of the periodic interval, the smoother did not have equal slopes and the method does not