English

Rick Wicklin 0
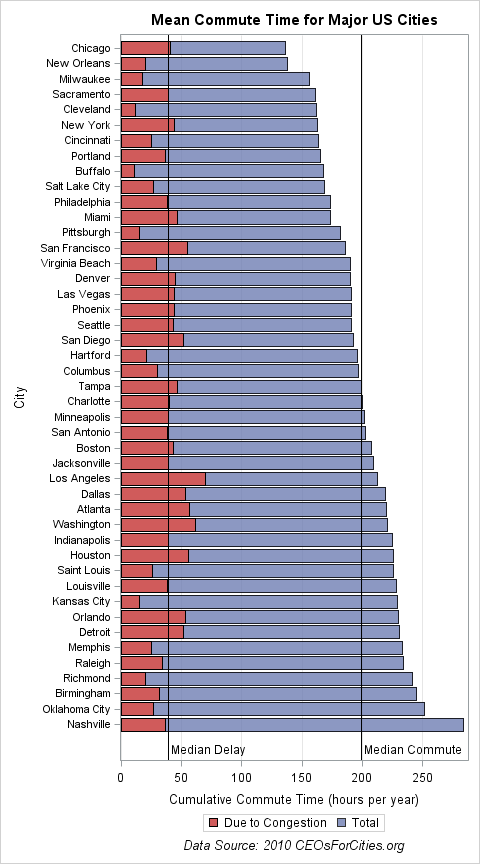
Visualizing US commute times and congestion

Robert Allison posted a map that shows the average commute times for major US cities, along with the proportion of the commute that is attributed to traffic jams and other congestion. The data are from a CEOs for Cities report (Driven Apart, 2010, p. 45). Robert use SAS/GRAPH software to

SAS Events
Kathy Council 0
My challenge to you

As summer comes to an end, I find myself getting excited about some of the regional user group conferences that take place every fall. This year, I’ll be presenting a paper at WUSS (Western Users of SAS Software) in Long Beach, CA, in early September. About one week later, I’m