
The next wave of MDM: Integrating structured and unstructured data

.@philsimon on what's next for MDM applications.
.@philsimon on what's next for MDM applications.
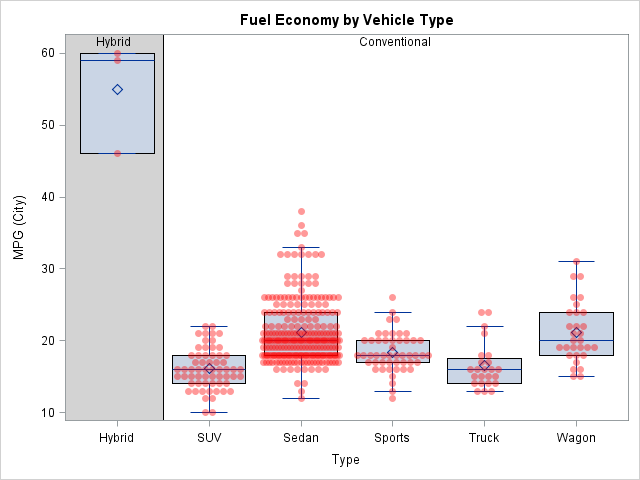
Box plots summarize the distribution of a continuous variable. You can display multiple box plots in a single graph by specifying a categorical variable. The resulting graph shows the distribution of subpopulations, such as different experimental groups. In the SGPLOT procedure, you can use the CATEGORY= option on the VBOX
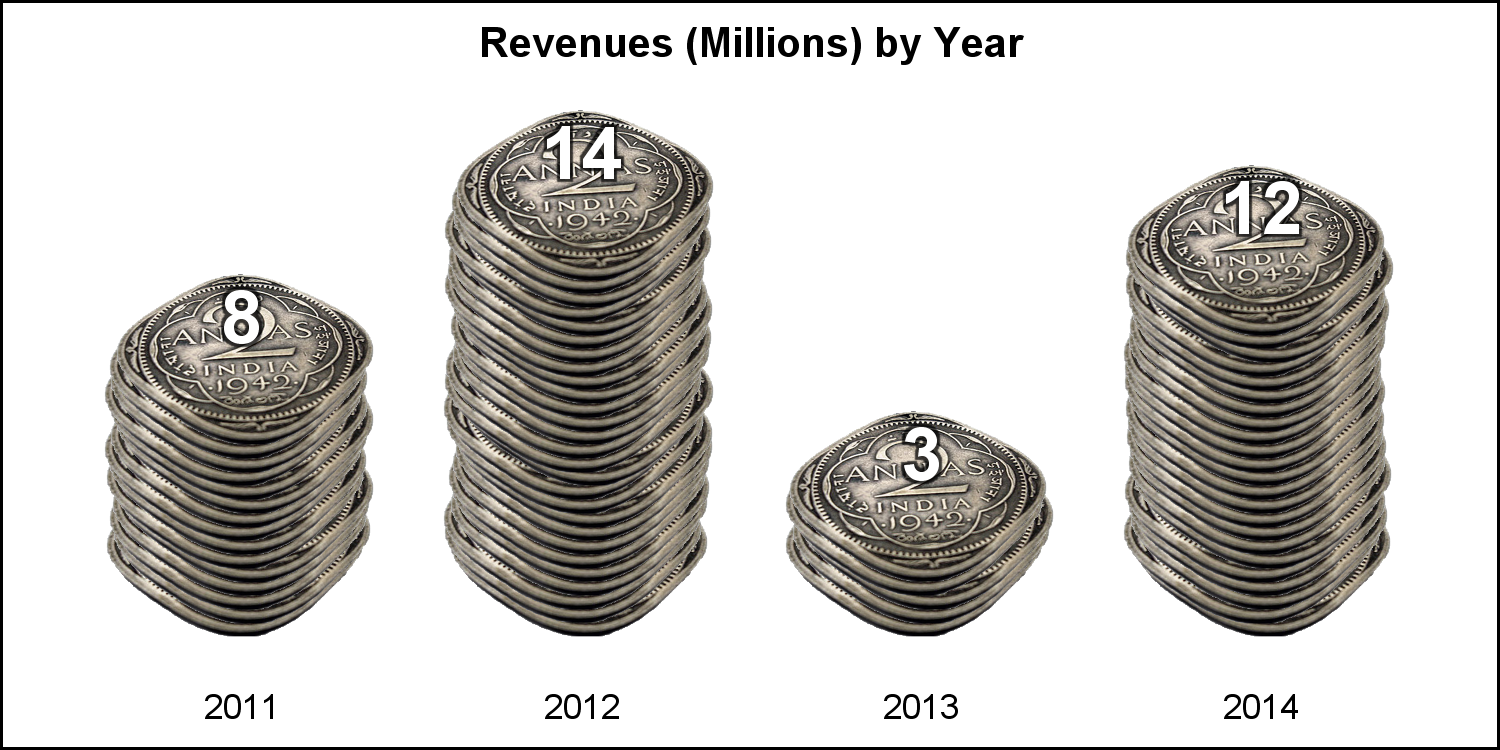
Often we see bar charts showing revenues or other related measures by a classifier using a visual of a stack of coins. Such visuals are not strictly for the purposes of accurate magnitude comparisons, but more for providing an interesting visual to attract the attention of the reader. In other words -

