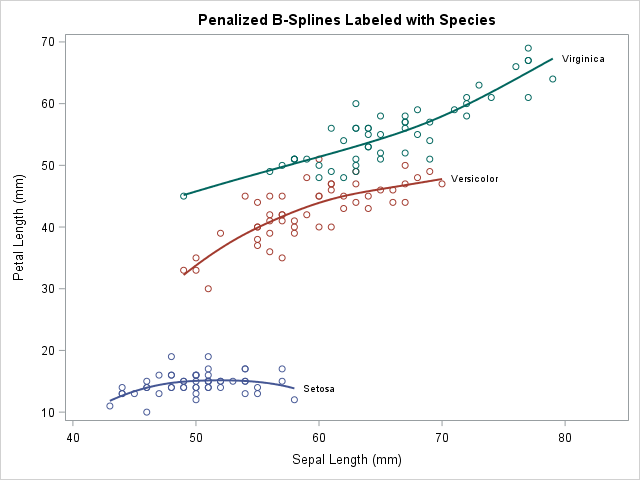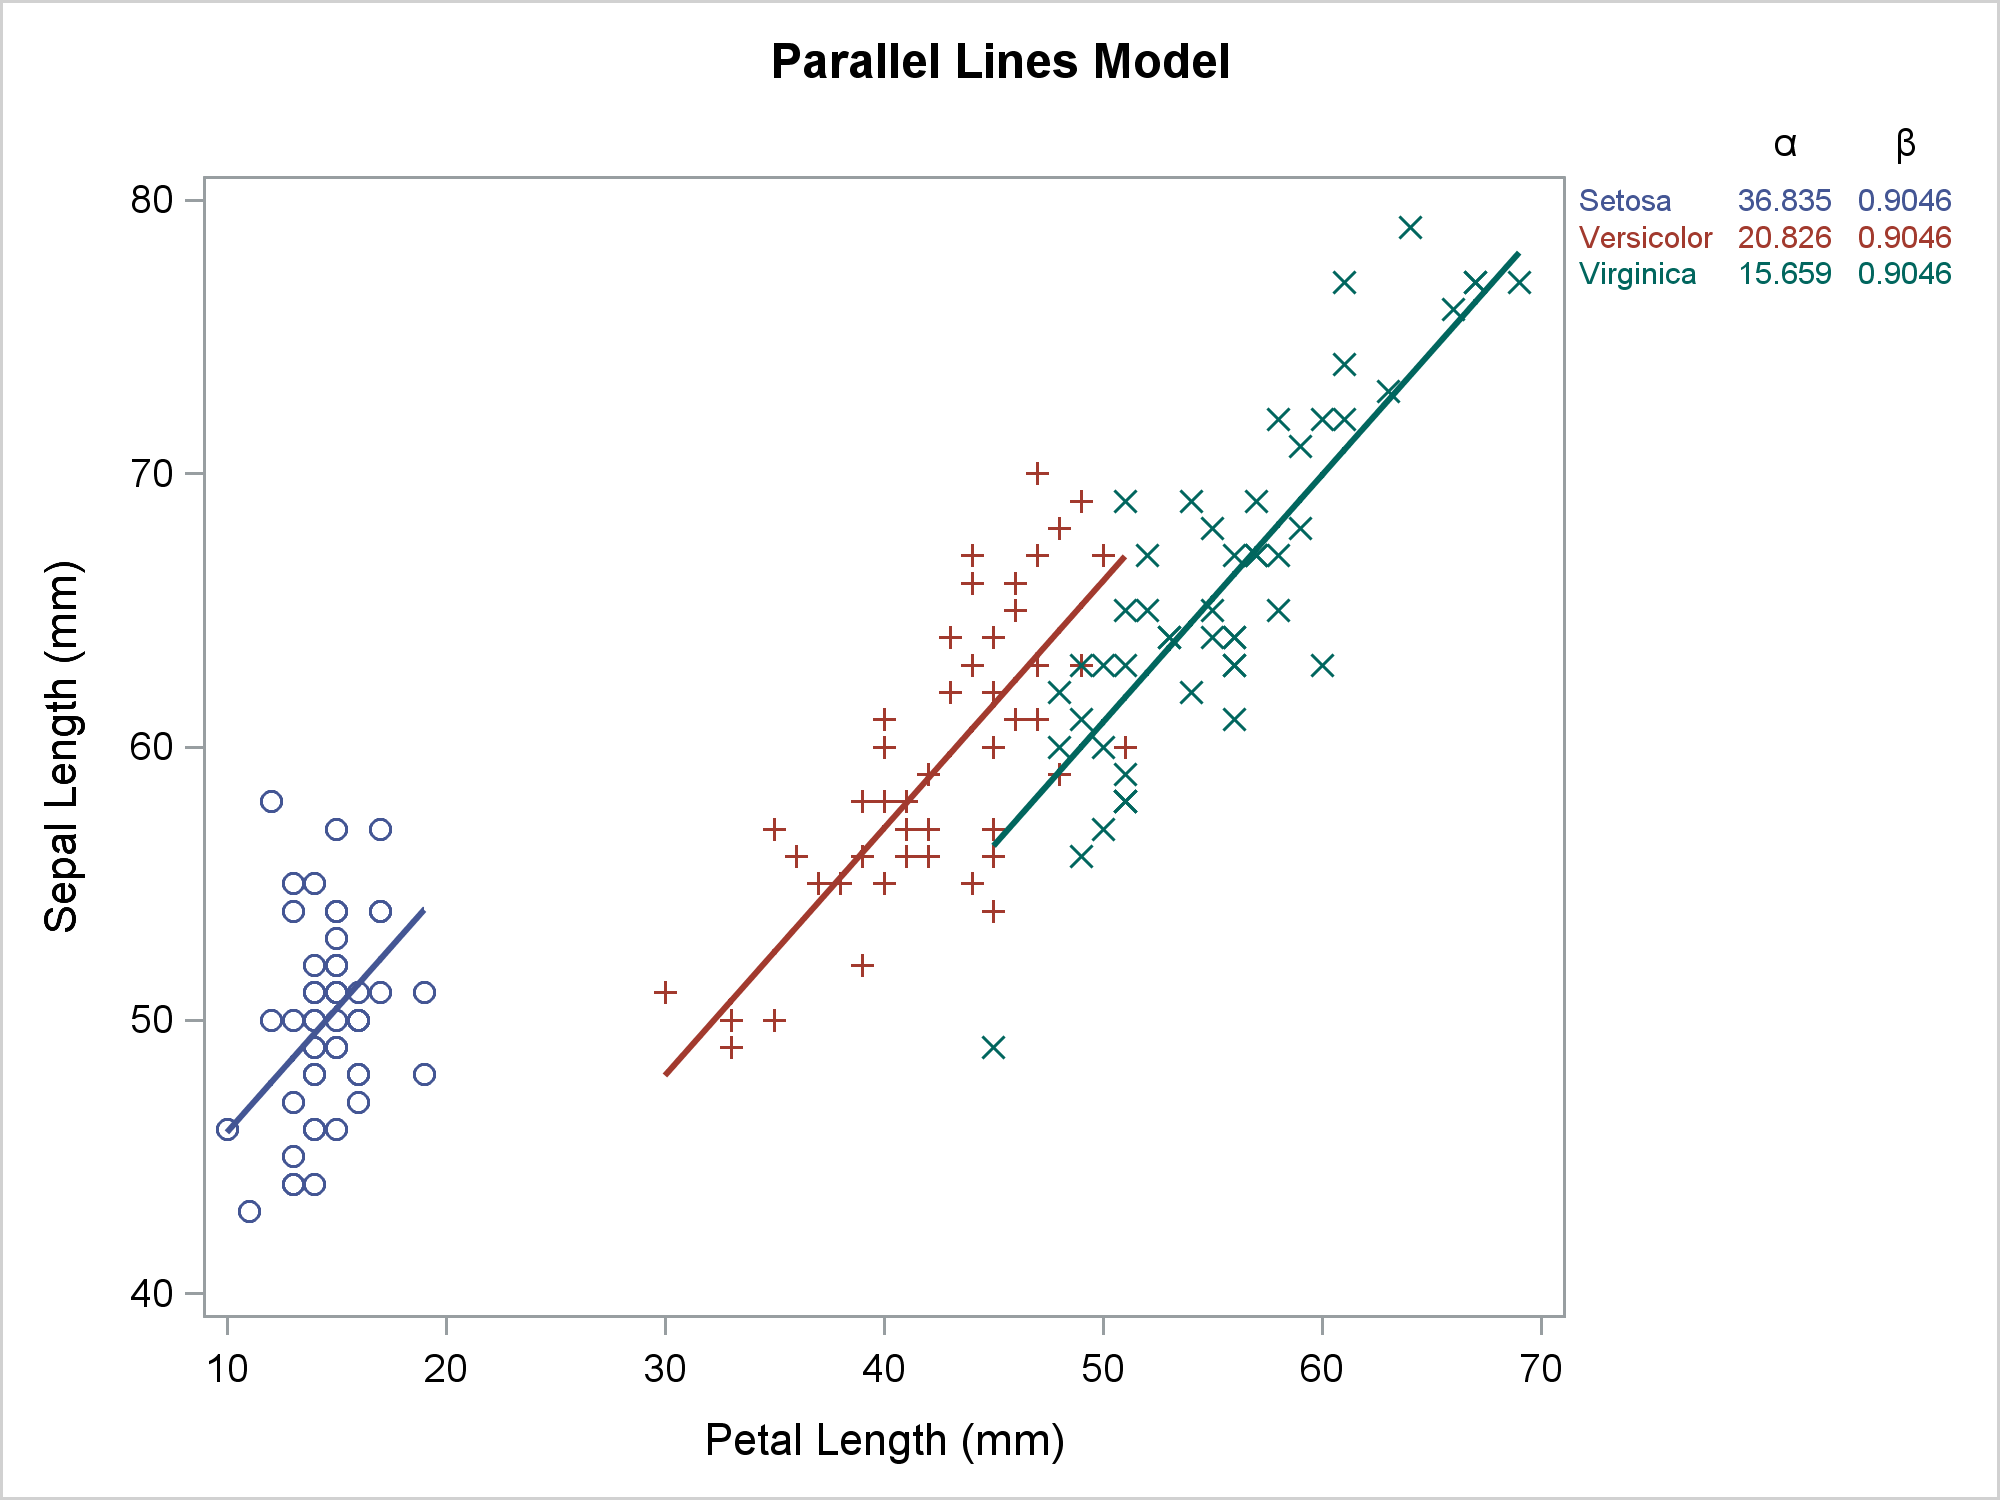
Usually, you use axis tables when there is a clear link between the rows of the axis table and the graph. I'll show how to use an axis table to create a table that is independent of the graph. This post also uses discrete attribute maps.
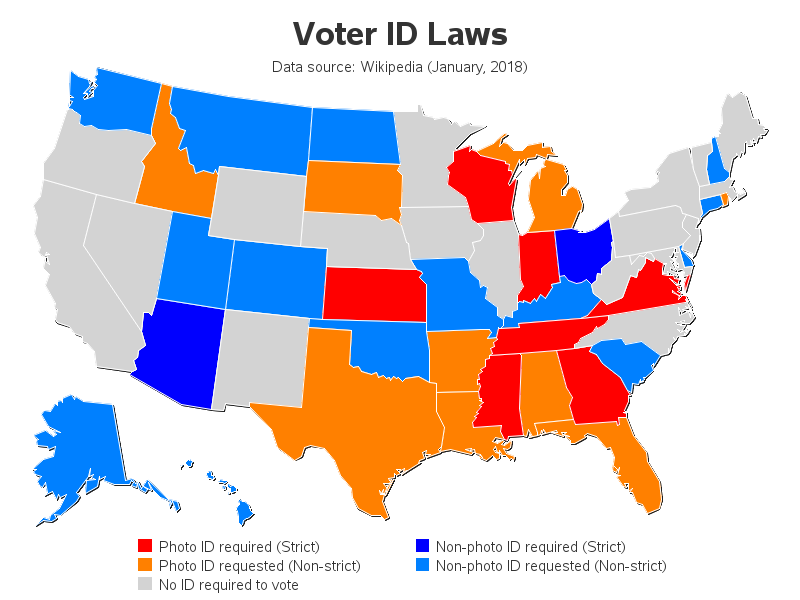

The first time I voted (back in the 1980s), I was very surprised that I didn't have to show any kind of identification. I assumed it was because I lived in a small North Carolina town of 300 people where "everybody knew everybody" ... but they told me that nobody
A SAS programmer asked how to label multiple regression lines that are overlaid on a single scatter plot. Specifically, he asked to label the curves that are produced by using the REG statement with the GROUP= option in PROC SGPLOT. He wanted the labels to be the slope and intercept