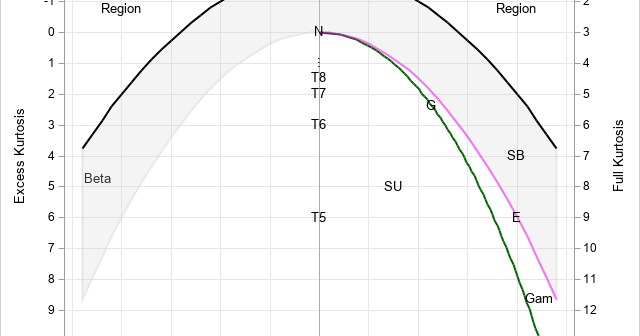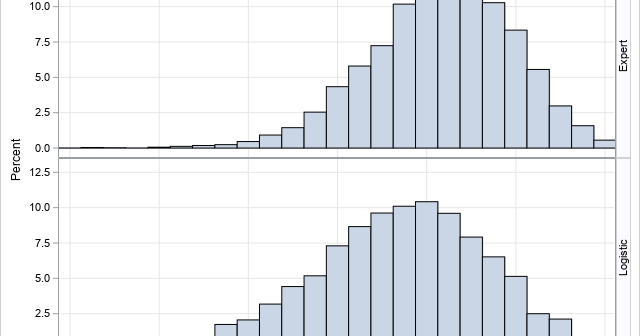
In my book Simulating Data with SAS, I show how to use a graphical tool, called the moment-ratio diagram, to characterize and compare continuous probability distributions based on their skewness and kurtosis (Wicklin, 2013, Chapter 16). The idea behind the moment-ratio diagram is that skewness and kurtosis are essential for
Tag: Statistical Thinking
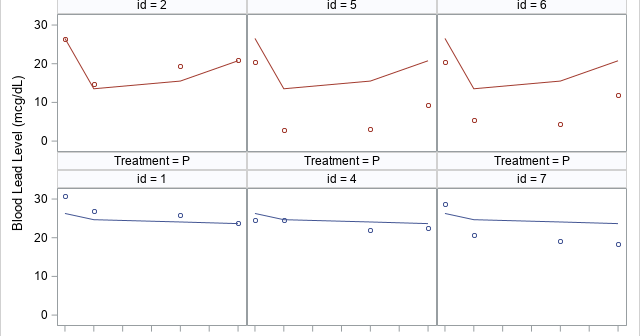
Longitudinal data are used in many health-related studies in which individuals are measured at multiple points in time to monitor changes in a response variable, such as weight, cholesterol, or blood pressure. There are many excellent articles and books that describe the advantages of a mixed model for analyzing longitudinal
In a linear regression model, the predicted values are on the same scale as the response variable. You can plot the observed and predicted responses to visualize how well the model agrees with the data, However, for generalized linear models, there is a potential source of confusion. Recall that a
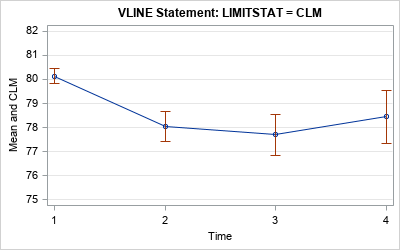
In a previous article, I mentioned that the VLINE statement in PROC SGPLOT is an easy way to graph the mean response at a set of discrete time points. I mentioned that you can choose three options for the length of the "error bars": the standard deviation of the data,
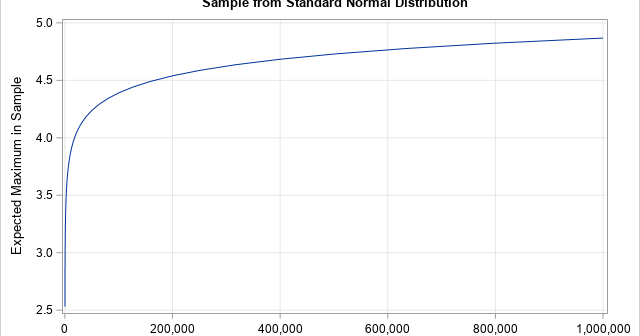
Is 4 an extreme value for the standard normal distribution? In high school, students learn the famous 68-95-99.7 rule, which is a way to remember that 99.7 percent of random observation from a normal distribution are within three standard deviations from the mean. For the standard normal distribution, the probability
At SAS Global Forum 2019, Daymond Ling presented an interesting discussion of binary classifiers in the financial industry. The discussion is motivated by a practical question: If you deploy a predictive model, how can you assess whether the model is no longer working well and needs to be replaced? Daymond
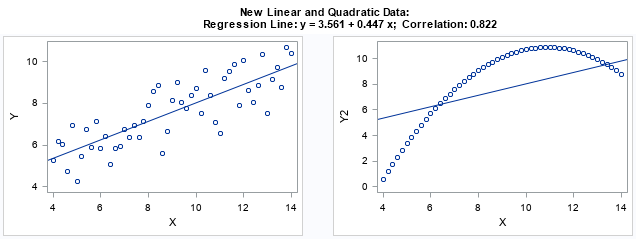
I think every course in exploratory data analysis should begin by studying Anscombe's quartet. Anscombe's quartet is a set of four data sets (N=11) that have nearly identical descriptive statistics but different graphical properties. They are a great reminder of why you should graph your data. You can read about
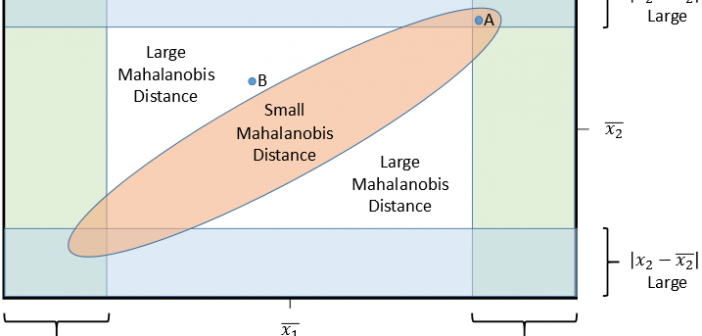
An important concept in multivariate statistical analysis is the Mahalanobis distance. The Mahalanobis distance provides a way to measure how far away an observation is from the center of a sample while accounting for correlations in the data. The Mahalanobis distance is a good way to detect outliers in multivariate
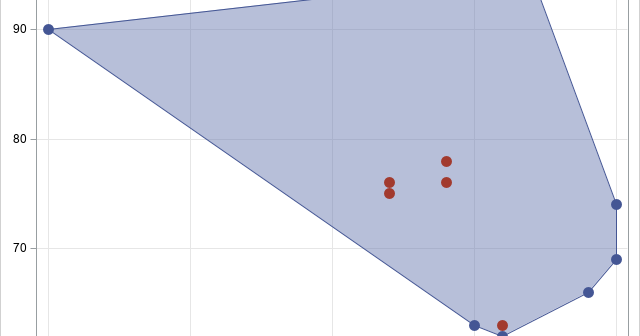
Statisticians often emphasize the dangers of extrapolating from a univariate regression model. A common exercise in introductory statistics is to ask students to compute a model of population growth and predict the population far in the future. The students learn that extrapolating from a model can result in a nonsensical
Feature generation (also known as feature creation) is the process of creating new features to use for training machine learning models. This article focuses on regression models. The new features (which statisticians call variables) are typically nonlinear transformations of existing variables or combinations of two or more existing variables. This