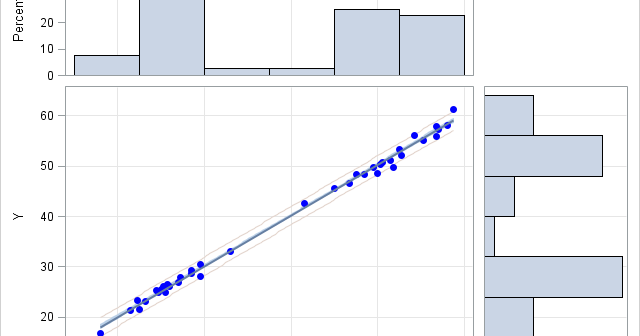
A frequent topic on SAS discussion forums is how to check the assumptions of an ordinary least squares linear regression model. Some posts indicate misconceptions about the assumptions of linear regression. In particular, I see incorrect statements such as the following: Help! A histogram of my variables shows that they
Tag: Statistical Thinking
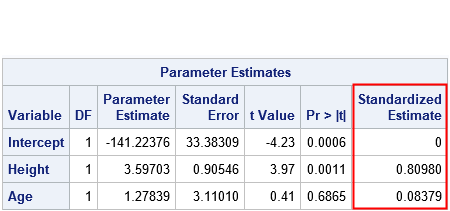
A SAS programmer recently asked how to interpret the "standardized regression coefficients" as computed by the STB option on the MODEL statement in PROC REG and other SAS regression procedures. The SAS documentation for the STB option states, "a standardized regression coefficient is computed by dividing a parameter estimate by
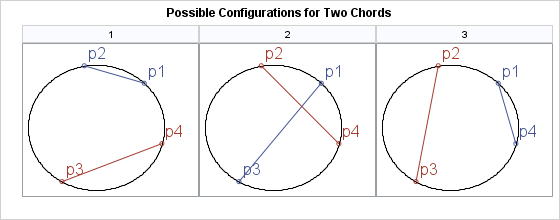
In a previous article, I showed how to find the intersection (if it exists) between two line segments in the plane. There are some fun problems in probability theory that involve intersections of line segments. One is "What is the probability that two randomly chosen chords of a circle intersect?"
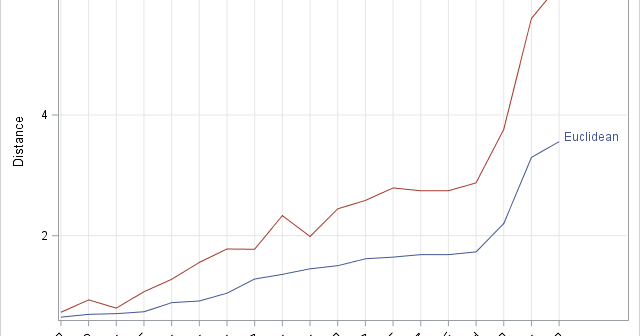
Suppose you want to find observations in multivariate data that are closest to a numerical target value. For example, for the students in the Sashelp.Class data set, you might want to find the students whose (Age, Height, Weight) values are closest to the triplet (13, 62, 100). The way to
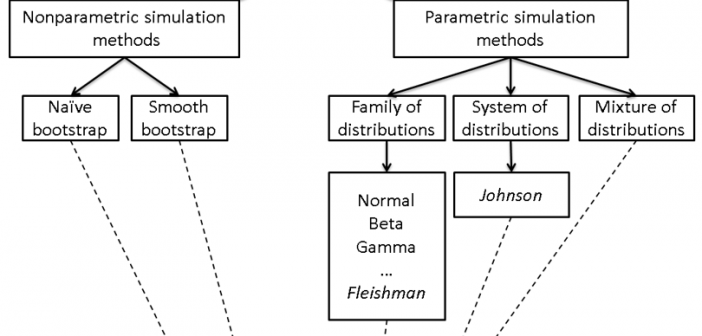
Last week I got the following message: Dear Rick: How can I create a normal distribution within a specified range (min and max)? I need to simulate a normal distribution that fits within a specified range. I realize that a normal distribution is by definition infinite... Are there any alternatives,
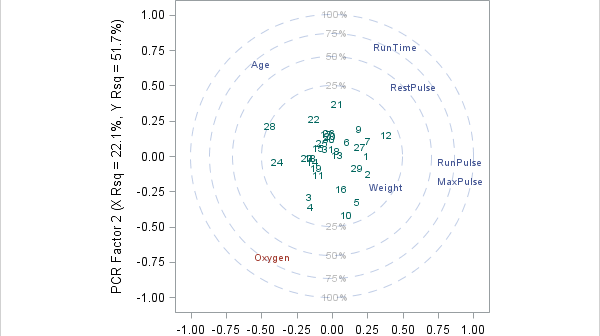
This article describes the advantages and disadvantages of principal component regression (PCR). This article also presents alternative techniques to PCR. In a previous article, I showed how to compute a principal component regression in SAS. Recall that principal component regression is a technique for handling near collinearities among the regression
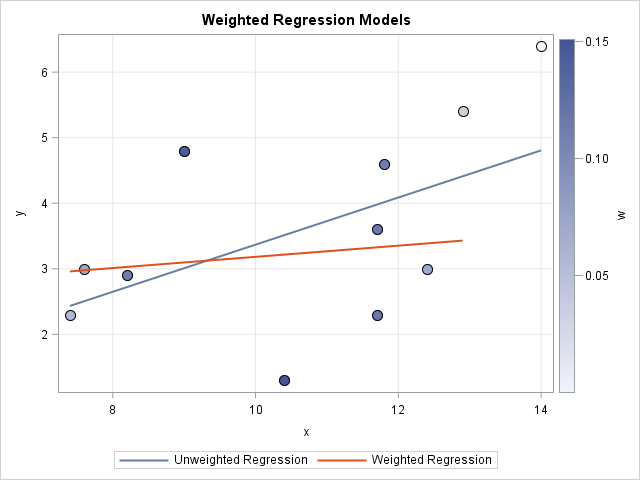
How can you specify weights for a statistical analysis? Hmmm, that's a "weighty" question! Many people on discussion forums ask "What is a weight variable?" and "How do you choose a weight for each observation?" This article gives a brief overview of weight variables in statistics and includes examples of
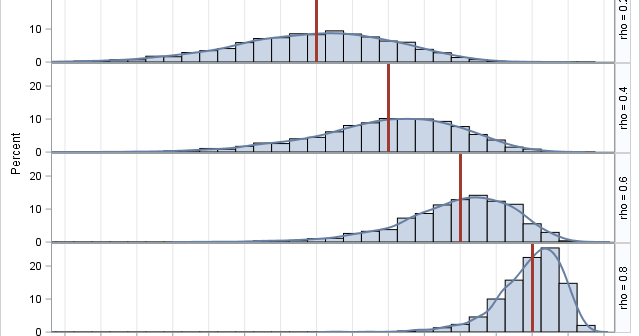
Pearson's correlation measures the linear association between two variables. Because the correlation is bounded between [-1, 1], the sampling distribution for highly correlated variables is highly skewed. Even for bivariate normal data, the skewness makes it challenging to estimate confidence intervals for the correlation, to run one-sample hypothesis tests ("Is
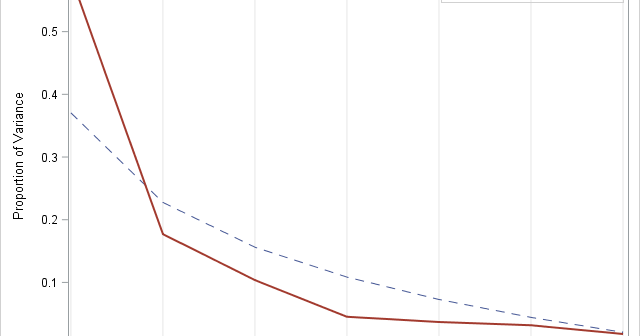
Last week I blogged about the broken-stick problem in probability, which reminded me that the broken-stick model is one of the many techniques that have been proposed for choosing the number of principal components to retain during a principal component analysis. Recall that for a principal component analysis (PCA) of
Skewness is a measure of the asymmetry of a univariate distribution. I have previously shown how to compute the skewness for data distributions in SAS. The previous article computes Pearson's definition of skewness, which is based on the standardized third central moment of the data. Moment-based statistics are sensitive to