Tag: Statistical Thinking

Rick Wicklin 3
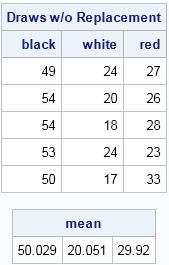
Balls and urns Part 2: Multi-colored balls

In a previous post I described how to simulate random samples from an urn that contains colored balls. The previous article described the case where the balls can be either of two colors. In that csae, all the distributions are univariate. In this article I examine the case where the

Rick Wicklin 6
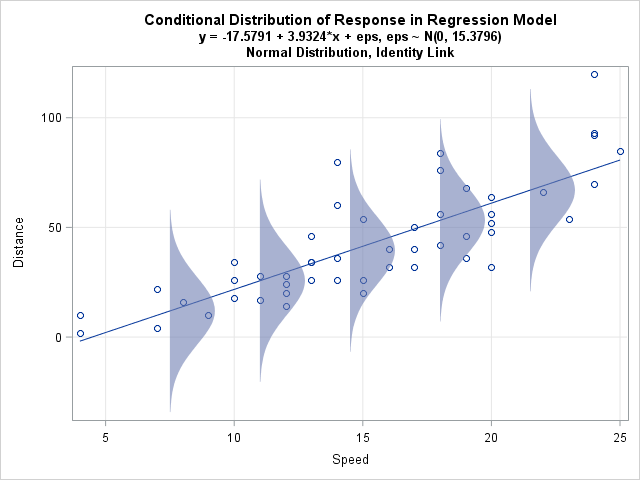
Error distributions and exponential regression models

Last week I discussed ordinary least squares (OLS) regression models and showed how to illustrate the assumptions about the conditional distribution of the response variable. For a single continuous explanatory variable, the illustration is a scatter plot with a regression line and several normal probability distributions along the line. The

Rick Wicklin 14
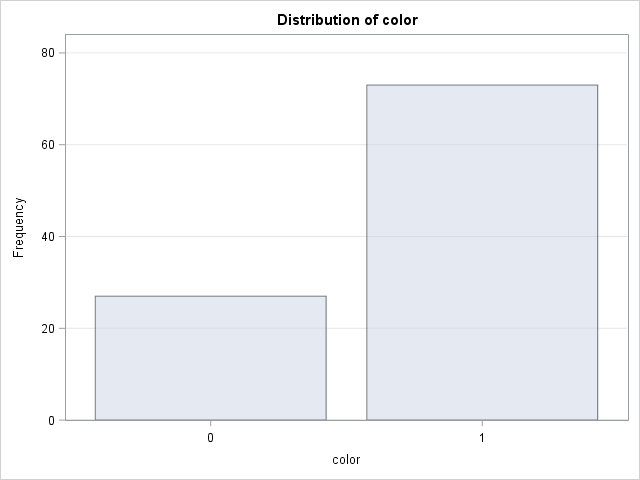
Simulate the Monty Hall Problem in SAS

The Monty Hall Problem is one of the most famous problems in elementary probability. It is famous because the correct solution is counter-intuitive and because it caused an uproar when it appeared in the "Ask Marilyn" column in Parade magazine in 1990. Discussing the problem has been known to create

Rick Wicklin 19
What is the coefficient of variation?

I sometimes wonder whether some functions and options in SAS software ever get used. Last week I was reviewing new features that were added to SAS/IML 13.1. One of the new functions is the CV function, which computes the sample coefficient of variation for data. Maybe it is just me,

Rick Wicklin 9
Does this kurtosis make my tail look fat?

What is kurtosis? What does negative or positive kurtosis mean, and why should you care? How do you compute kurtosis in SAS software? It is not clear from the definition of kurtosis what (if anything) kurtosis tells us about the shape of a distribution, or why kurtosis is relevant to

1 5 6 7 8 9 10