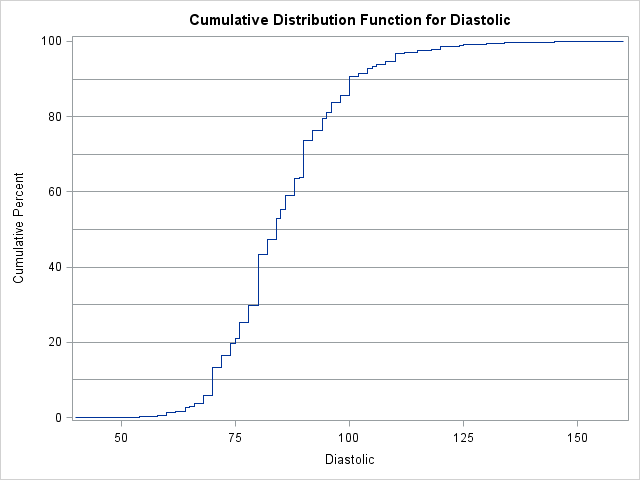
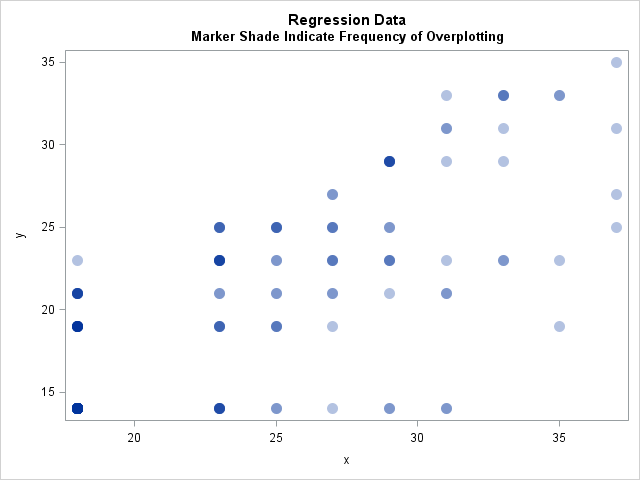
In my article about how to create a quantile plot, I chose not to discuss a theoretical issue that occasionally occurs. The issue is that for discrete data (which includes rounded values), it might be impossible to use quantile values to split the data into k groups where each group
Tag: Statistical Thinking
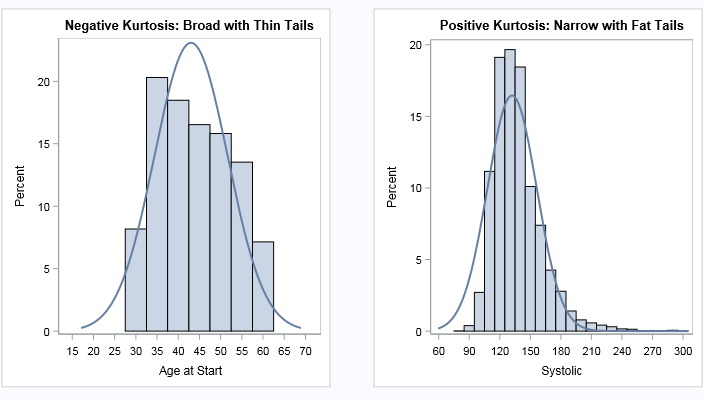
What is kurtosis? What does negative or positive kurtosis mean, and why should you care? How do you compute kurtosis in SAS software? It is not clear from the definition of kurtosis what (if anything) kurtosis tells us about the shape of a distribution, or why kurtosis is relevant to
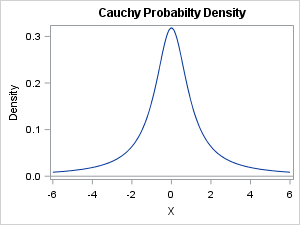
The tail of a probability distribution is an important notion in probability and statistics, but did you know that there is not a rigorous definition for the "tail"? The term is primarily used intuitively to mean the part of a distribution that is far from the distribution's peak or center.
Wisdom has built her house; She has hewn out her seven pillars. – Proverbs 9:1 At the 2014 Joint Statistical Meetings in Boston, Stephen Stigler gave the ASA President's Invited Address. In forty short minutes, Stigler laid out his response to the age-old question "What is statistics?" His answer was
As the International Year of Statistics comes to a close, I've been reflecting on the role statistics plays in our modern society. Of course, statistics provides estimates, forecasts, and the like, but to me the great contribution of statistics is that it enables us to deal with uncertainty in a
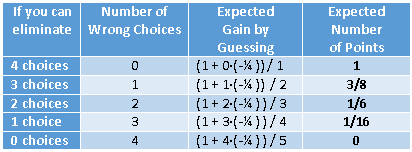
Should you ever guess on the SAT® or PSAT standardized tests? My son is getting ready to take the preliminary SAT (PSAT), which is a practice test for the SAT. A teacher gave his class this advice regarding guessing: For a multiple-choice questions, if you can eliminate one or two
This week I read an interesting blog post that led to a discussion about specifying the frequencies of observations in a regression model. In SAS software, many of the analysis procedures contain a FREQ statement for specifying frequencies and a WEIGHT statement for specifying weights in a weighted regression. Theis
As I wrote in my previous post, a SAS customer noticed that he was getting some duplicate values when he used the RAND function to generate a large number of random uniform values on the interval [0,1]. He wanted to know if this result indicates a bug in the RAND
Tossing dice is a simple and familiar process, yet it can illustrate deep and counterintuitive aspects of random numbers. For example, if you toss four identical six-sided dice, what is the probability that the faces are all distinct, as shown to the left? Many people would guess that the probability
I often see variations of the following question posted on statistical discussion forums: I want to bin the X variable into a small number of values. For each bin, I want to draw the quartiles of the Y variable for that bin. Then I want to connect the corresponding quartile