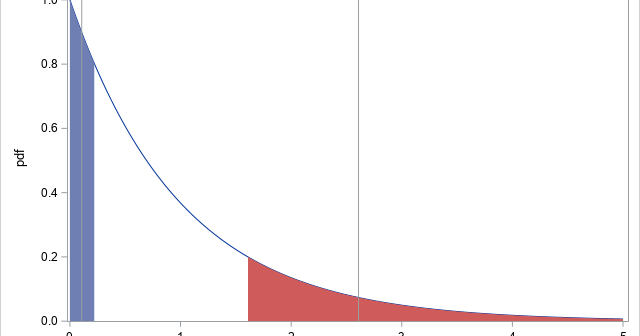
If you have been learning about machine learning or mathematical statistics, you might have heard about the Kullback–Leibler divergence. The Kullback–Leibler divergence is a measure of dissimilarity between two probability distributions. It measures how much one distribution differs from a reference distribution. This article explains the Kullback–Leibler divergence and shows
Tag: Statistical Programming
A SAS/IML programmer asked about the best way to print multiple SAS/IML variables when each variable needs a different format. He wanted the output to resemble the "Parameter Estimates" table that is produced by PROC REG and other SAS/STAT procedures. This article shows four ways to print SAS/IML vectors in
Books about statistics and machine learning often discuss the tradeoff between bias and variance for an estimator. These discussions are often motivated by a sophisticated predictive model such as a regression or a decision tree. But the basic idea can be seen in much simpler situations. This article presents a
In a previous article, I discussed the binormal model for a binary classification problem. This model assumes a set of scores that are normally distributed for each population, and the mean of the scores for the Negative population is less than the mean of scores for the Positive population. I
Suppose that a data set contains a set of parameter values. For each row of parameters, you need to perform some computation. A recent discussion on the SAS Support Communities mentions an important point: if there are duplicate rows in the data, a program might repeat the same computation several
The ROC curve is a graphical method that summarizes how well a binary classifier can discriminate between two populations, often called the "negative" population (individuals who do not have a disease or characteristic) and the "positive" population (individuals who do have it). As shown in a previous article, there is
Are you a statistical programmer whose company has adopted SAS Viya? If so, you probably know that the DATA step can run in parallel in SAS Cloud Analytic Services (CAS). As Sekosky (2017) says, "running in a single thread in SAS is different from running in many threads in CAS."
The Johnson system (Johnson, 1949) contains a family of four distributions: the normal distribution, the lognormal distribution, the SB distribution (which models bounded distributions), and the SU distribution (which models unbounded distributions). Note that 'B' stands for 'bounded' and 'U' stands for 'unbounded.' A previous article explains the purpose of
From the early days of probability and statistics, researchers have tried to organize and categorize parametric probability distributions. For example, Pearson (1895, 1901, and 1916) developed a system of seven distributions, which was later called the Pearson system. The main idea behind a "system" of distributions is that for each
What is an efficient way to evaluate a multivariate quadratic polynomial in p variables? The answer is to use matrix computations! A multivariate quadratic polynomial can be written as the sum of a purely quadratic term (degree 2), a purely linear term (degree 1), and a constant term (degree 0).