SAS supports more than 25 common probability distributions for the PDF, CDF, QUANTILE, and RAND functions. Of course, there are infinitely many distributions, so not every possible distribution is supported. If you need a less-common distribution, I've shown how to extend the functionality of Base SAS (by using PROC FCMP)
Tag: Statistical Programming
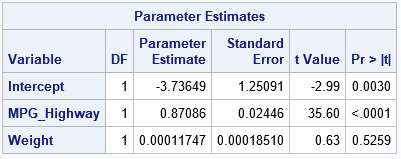
SAS/STAT software contains a number of so-called HP procedures for training and evaluating predictive models. ("HP" stands for "high performance.") A popular HP procedure is HPLOGISTIC, which enables you to fit logistic models on Big Data. A goal of the HP procedures is to fit models quickly. Inferential statistics such
Recently I wrote about how to compute the Kolmogorov D statistic, which is used to determine whether a sample has a particular distribution. One of the beautiful facts about modern computational statistics is that if you can compute a statistic, you can use simulation to estimate the sampling distribution of
Have you ever run a statistical test to determine whether data are normally distributed? If so, you have probably used Kolmogorov's D statistic. Kolmogorov's D statistic (also called the Kolmogorov-Smirnov statistic) enables you to test whether the empirical distribution of data is different than a reference distribution. The reference distribution
SAS regression procedures support several parameterizations of classification variables. When a categorical variable is used as an explanatory variable in a regression model, the procedure generates dummy variables that are used to construct a design matrix for the model. The process of forming columns in a design matrix is called
Did you know that SAS provides built-in support for working with probability distributions that are finite mixtures of normal distributions? This article shows examples of using the "NormalMix" distribution in SAS and describes a trick that enables you to easily work with distributions that have many components. As with all
I think every course in exploratory data analysis should begin by studying Anscombe's quartet. Anscombe's quartet is a set of four data sets (N=11) that have nearly identical descriptive statistics but different graphical properties. They are a great reminder of why you should graph your data. You can read about
Suppose you need to assign 100 patients equally among 3 treatment groups in a clinical study. Obviously, an equal allocation is impossible because the second number does not evenly divide the first, but you can get close by assigning 34 patients to one group and 33 to the others. Mathematically,
Many SAS procedures support the BY statement, which enables you to perform an analysis for subgroups of the data set. Although the SAS/IML language does not have a built-in "BY statement," there are various techniques that enable you to perform a BY-group analysis. The two I use most often are
When you use maximum likelihood estimation (MLE) to find the parameter estimates in a generalized linear regression model, the Hessian matrix at the optimal solution is very important. The Hessian matrix indicates the local shape of the log-likelihood surface near the optimal value. You can use the Hessian to estimate