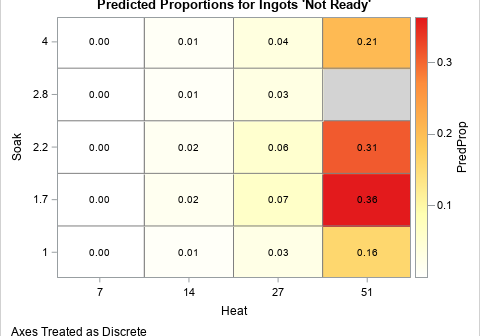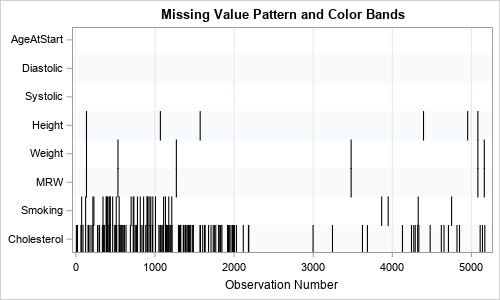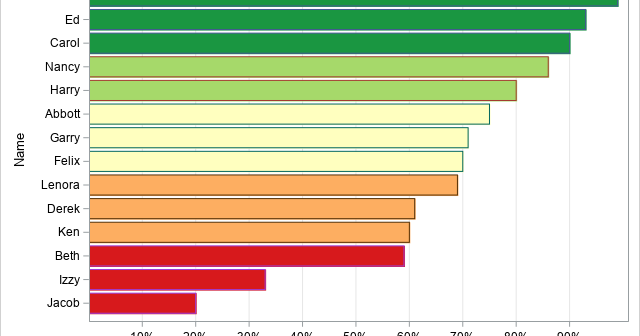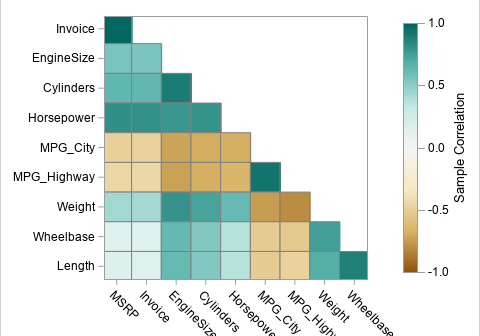
In SAS, range attribute maps enable you to specify the range of values that determine the colors used for graphical elements. There are various examples that use the GTL to define a range attribute map, but fewer examples that show how to use a range attribute map with PROC SGPLOT.

