Since the COVID-19 pandemic began, video presentations and webcasts have become a regular routine for many of us. On days that I will be using my webcam, I wear a solid-color shirt. If I don't plan to be on camera, I can wear a pinstripe Oxford shirt. Why the difference? Two words: moiré patterns! The animation to the right illustrates a series of moiré patterns that are caused by rotating a set of vertical lines relative to another fixed set.
Although I've known about moiré patterns for years, it wasn't until I started using my webcam at work that I truly realized what a horrible distraction it can be to wear a striped (or checkered) shirt on a video call. This article shows a simple example that illustrates a moiré pattern.
Incidentally, I always thought that moiré patterns were named after a person and that the first word should be capitalized. But in fact "moiré" is a French word that means "watered." These patterns were intentionally pressed into certain textile fabrics to give them an appearance that looks like ripples in a basin or water.
I was going to upload a video of myself wearing a striped shirt, but others have already done it. Check out this video of a man wearing a stripe shirt to watch the moiré patterns as he slightly moves his torso.
What are moiré patterns?
A moiré pattern is an interference pattern that appears when two overlaid grids or grates are misaligned. The misalignment can take many forms, and each form results in a different moiré pattern. For example, one grid might have wider gaps than the other. Or one grid might be offset from the other. Or one grid might be rotated relative to the other. There are many interesting videos about moiré patterns on YouTube; here is one video about moiré patterns to get you started.
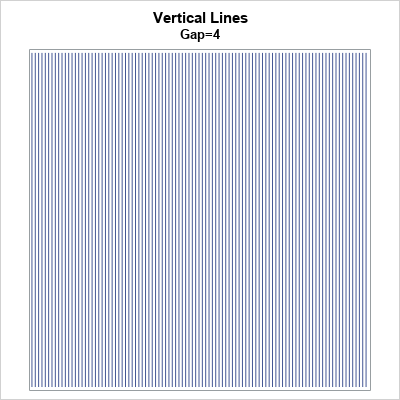
The following image shows a vertical grate that contains many uniformly spaced parallel lines. The simplest moiré pattern results from overlaying two vertical grids. When one is rotated relative to the other, you can use trigonometry to understand that way that the lines intersect. Briefly, where the lines intersect, the superposition is dark. This gives rise to an apparent series of parallel dark bands, called moiré bands. You can derive mathematical equations that give the angle of the moiré bands and the gap between them as a function of the gaps between the original lines and the angle of rotation.
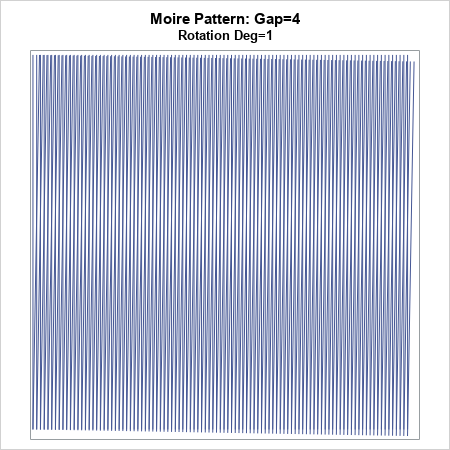
The following images show the moiré bands for overlaying two identical grates. In the first image, one grate is rotated by 1 degree. You can see two dark and two light moiré bands. The band have a very small negative slope. The dark bands occur at the intersection of the vertical lines; the light bands occur at the intersection of the gaps. The bands are parallel.
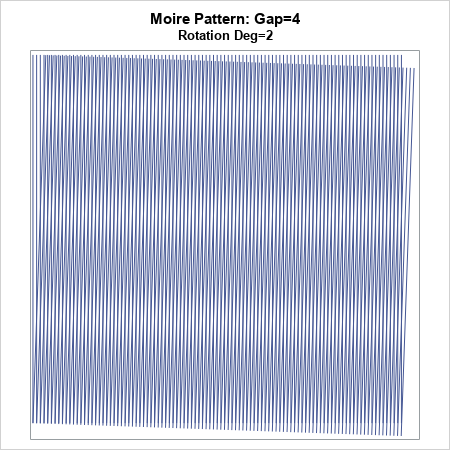
The second image shows an overlay of the same grates, but this time one grate is rotated by 2 degrees. You can see four dark and two light moiré bands. The band have a small negative slope.
If you generate a sequence of images for varying rotation amounts, you can see the rippling effect that is so distracting on video calls when someone wears a striped shirt. An animation is shown at the top of this article. The animation is formed by creating moiré patterns for the rotations in the range [-5, 5] degrees. This is the effect you might see when someone is a striped shirt rotates his torso, sways, or even takes a deep breath.
How do moiré patterns occur in video?
When we take a video, we aren't overlaying two grids, so how do moiré patterns appear in videos? I've yet to find a satisfactory explanation online but recall that computer monitors contain pixels that are arranged in regular grid. Similarly, your web cam digitizes your image into a grid of pixels. So, there are a lot of horizontal and vertical features (pixels) that interact during a video call.
When the web cam takes a picture of a striped shirt, the shirt is digitized into an array of pixels. The array is a sample of the image in front of the camera. Some pixels are perfectly aligned with a stripe and appear dark. Others are perfectly aligned with the gaps between the stripes and appear light. Most pixels, however, are imperfectly aligned with the stripes. The pixels are assigned a shade and a brightness that are determined by some image-processing algorithm and might be processed further by an anti-aliasing algorithm. This light-dark pattern can create moiré patterns in the image.
The problems do not stop there. The image is transmitted to a computer monitor, which has it's own array of pixels. During a presentation, the image is often shrunk into a small image in the corner so that a slide show can occupy most of the screen. This shrinking induces additional artifacts. It gets complicated fast.
Although the digitization of a striped shirt in a video is more complicated than overlaying two grids, the result is the same: an interference pattern where some pixels are dark, and others are light. In short, a moiré pattern.
Summary
Moiré patterns appear when two grids do not perfectly align. The resulting interference pattern can be distracting to the viewer. The easiest way to avoid a moiré pattern is to wear solid-colored garments.
Appendix: A SAS program to generate a moiré pattern
All the images in this article were generated by using the following SAS program. Feel free to modify to construct your own images. Some readers might be interested in how I generated the animation. That was also done in SAS by using an animation technique that I have blogged about previously. See also Sanjay's description about how to animate images in SAS.
/* explore moire patterns. For the mathematics, see https://www.spiedigitallibrary.org/journals/optical-engineering/volume-57/issue-03/030803/Moir%C3%A9-effect-in-displays-a-tutorial/10.1117/1.OE.57.3.030803.full?SSO=1 */ /* 1. Show only the vertical lines of a grate */ ods graphics / width=400px height=400px antialias=ON; %let N=400; /* X range for lines */ %let Gap=4; data Vert; do Group = 0 to &N by &Gap; x = Group; y = 0; output; y = &N; output; end; run; title "Vertical Lines"; title2 "Gap=&Gap"; proc sgplot data=Vert noautolegend aspect=1; series x=x y=y / group=Group lineattrs=GraphData1; xaxis display=none; yaxis display=none; run; /**********/ /* 2. create a SAS macro to generate a vertical grate and then rotate a second grate by D degrees. Create a graph that overlays the grates. */ %macro MoireRot(N, Gap, deg); data Vert; do Group = 0 to &N by &Gap; x = Group; y = 0; output; y = &N; output; end; run; /* CLOCKWISE rotation by theta ==> counterclockwise rotation by -deg degrees */ data Moire; set Vert; theta = -° * constant('pi') / 180; /* negative because clockwise */ c = cos(theta); s = sin(theta); rx = c*x - s*y; ry = s*x + c*y; run; title "Moire Pattern: Gap=&Gap"; title2 "Rotation Deg=&Deg"; proc sgplot data=Moire noautolegend aspect=1; series x=x y=y / group=Group lineattrs=GraphData1; series x=rx y=ry / group=Group lineattrs=GraphData1; xaxis display=none; yaxis display=none; run; %mend; /* call the macro for some examples */ ods graphics / width=450px height=450px antialias=ON; %MoireRot(400, 4, 1); %MoireRot(400, 4, 2); /**********/ /* 3. Animation: Create a series of graphs. Write to animated gif. */ ods graphics / push width=3in height=3in imagefmt=GIF; options papersize=('3 in', '3 in') printerpath=gif animation=start nodate nonumber animduration=0.25 animloop=yes noanimoverlay; ods printer file='C:\Temp\Anim.gif'; ods html select none; %MoireRot(400, 4, 0); %MoireRot(400, 4, 1); %MoireRot(400, 4, 2); %MoireRot(400, 4, 3); %MoireRot(400, 4, 4); %MoireRot(400, 4, 5); %MoireRot(400, 4, 4); %MoireRot(400, 4, 3); %MoireRot(400, 4, 2); %MoireRot(400, 4, 1); %MoireRot(400, 4, 0); %MoireRot(400, 4, -1); %MoireRot(400, 4, -2); %MoireRot(400, 4, -3); %MoireRot(400, 4, -4); %MoireRot(400, 4, -5); %MoireRot(400, 4, -4); %MoireRot(400, 4, -3); %MoireRot(400, 4, -2); %MoireRot(400, 4, -1); ods html select all; options printerpath=gif animation=stop; ods printer close; ods graphics / pop; |

1 Comment
Rick,
In the first PROC SGPLOT ,the dataset should be "Vert" ?
proc sgplot data=Moire
-->
proc sgplot data=Vert
Otherwise, I would get ERROR info in log.