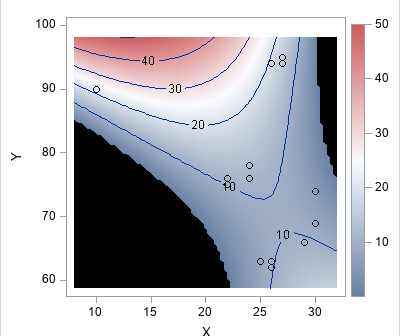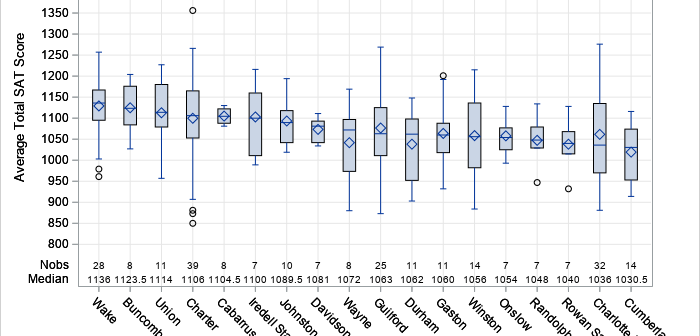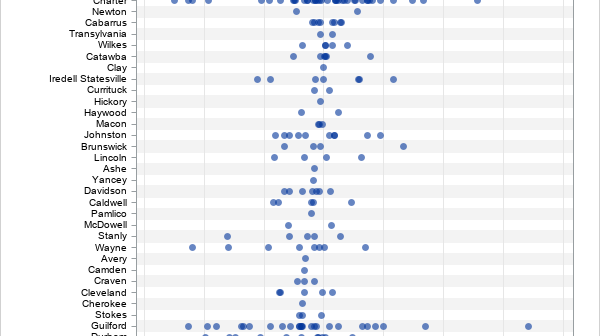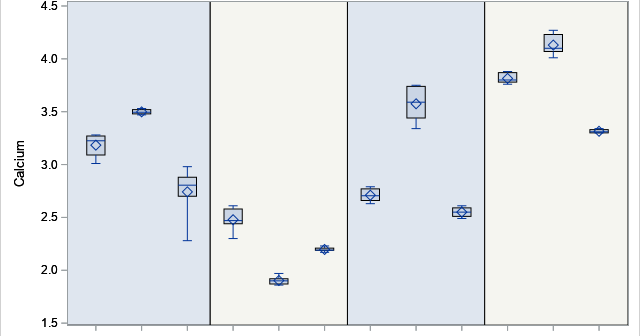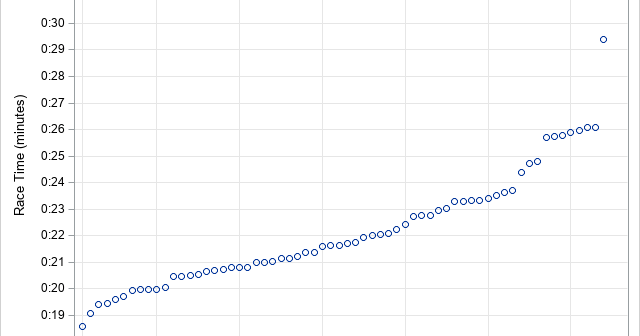
Math and statistics are everywhere, and I always rejoice when I spot a rather sophisticated statistical idea "in the wild." For example, I am always pleased when I see a graph that shows the distribution of race times in a typical race (such as a 5K), as shown to the

