The DO Loop
Statistical programming in SAS with an emphasis on SAS/IML programs
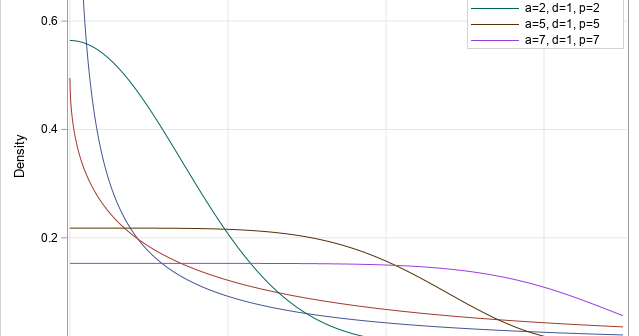
A SAS customer wanted to compute the cumulative distribution function (CDF) of the generalized gamma distribution. For any continuous distribution, the CDF is the integral of the probability density function (PDF), which usually has an explicit formula. Accordingly, he wanted to compute the CDF by using the QUAD function in

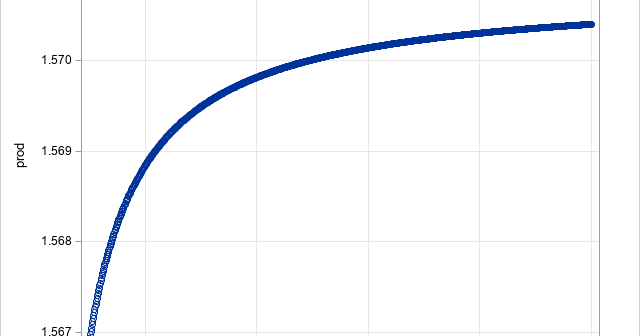
This is my Pi Day post for 2021. Every year on March 14th (written 3/14 in the US), geeky mathematicians and their friends celebrate "all things pi-related" because 3.14 is the three-decimal approximation to pi. Most years I write about lower-case pi (π), which is the ratio of a circle's

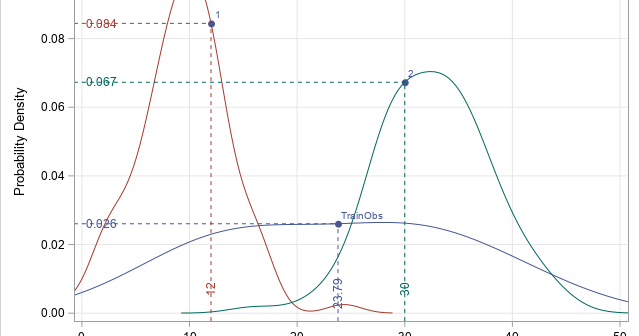
I recently learned about a new feature in PROC QUANTREG that was added in SAS/STAT 15.1 (part of SAS 9.4M6). Recall that PROC QUANTREG enables you to perform quantile regression in SAS. (If you are not familiar with quantile regression, see an earlier article that describes quantile regression and provides
