The DO Loop
Statistical programming in SAS with an emphasis on SAS/IML programs![Tabulate counts when there are unobserved categories](https://blogs.sas.com/content/iml/files/2015/10/t_tabulatelevels.png)
Suppose that you are tabulating the eye colors of students in a small class (following Friendly, 1992). Depending upon the ethnic groups of these students, you might not observe any green-eyed students. How do you put a 0 into the table that summarizes the number of students who have each
![How to generate random integers in SAS](https://blogs.sas.com/content/iml/files/2011/08/generaterandom.png)
You can use SAS to generate random integers between 1–10 or in the range 1–100. This article shows how to generate random integers as easily as Excel does. I was recently talking with some SAS customers and I was asked "Why can't SAS create an easy way to generate random
![Ten "one-liners" that create test matrices for statistical programmers](https://blogs.sas.com/content/iml/files/2017/02/AdvancedAnalytics-3.png)
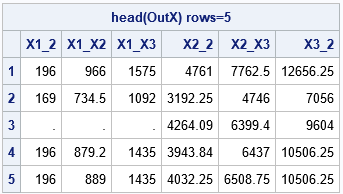
You've had a long day. You've implemented a custom algorithm in the SAS/IML language. But before you go home, you want to generate some matrices and test your program. If you are like me, you prefer a short statement—one line would be best. However, you also want the flexibility to
![Excluding variables: Read all but one variable into a matrix](https://blogs.sas.com/content/iml/files/2015/09/t_excludereadvar1.png)
Dear Rick, I have a data set with 1,001 numerical variables. One variable is the response, the others are explanatory variable. How can I read the 1,000 explanatory variables into an IML matrix without typing every name? That's a good question. You need to be able to perform two sub-tasks:
![Plot the conditional distribution of the response in a linear regression model](https://blogs.sas.com/content/iml/files/2015/09/GLM_normal_identity.png)
A friend who teaches courses about statistical regression asked me how to create a graph in SAS that illustrates an important concept: the conditional distribution of the response variable. The basic idea is to draw a scatter plot with a regression line, then overlay several probability distributions along the line,
![Those tricky PERCENT formats](https://blogs.sas.com/content/iml/files/2015/07/t_percent.png)
When using SAS to format a number as a percentage, there is a little trick that you need to remember: the width of the formatted value must include room for the decimal point, the percent sign, and the possibility of two parentheses that indicate negative values. The field width must