The DO Loop
Statistical programming in SAS with an emphasis on SAS/IML programs
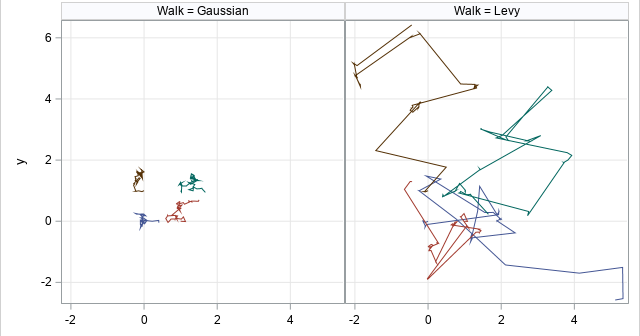
Imagine an animal that is searching for food in a vast environment where food is scarce. If no prey is nearby, the animal's senses (such as smell and sight) are useless. In that case, a reasonable search strategy is a random walk. The animal can choose a random direction, walk/swim/fly

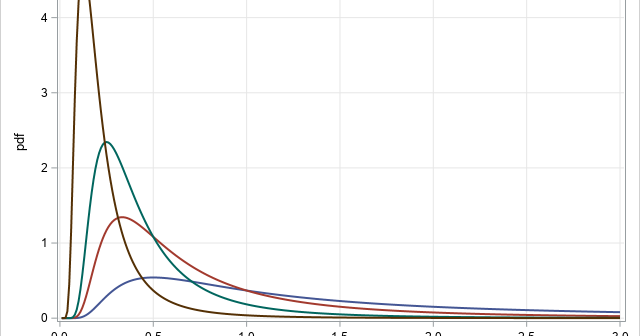
The inverse gamma distribution is a continuous probability distribution that is used in Bayesian analysis and in some statistical models. The inverse gamma distribution is closely related to the gamma distribution. For any probability distribution, it is essential to know how to compute four functions: the PDF function, which returns

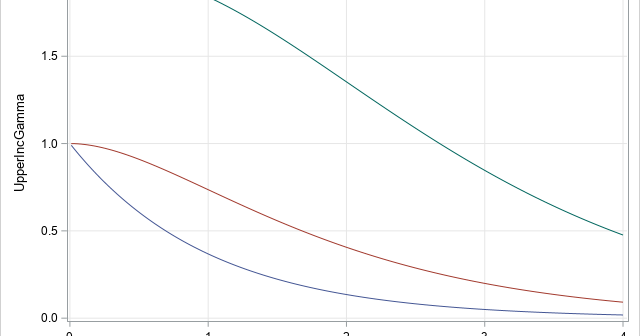
Years ago, I wrote about how to compute the incomplete beta function in SAS. Recently, a SAS programmer asked about a similar function, called the incomplete gamma function. The incomplete gamma function is a "special function" that arises in applied math, physics, and statistics. You should not confuse the gamma
