The DO Loop
Statistical programming in SAS with an emphasis on SAS/IML programs
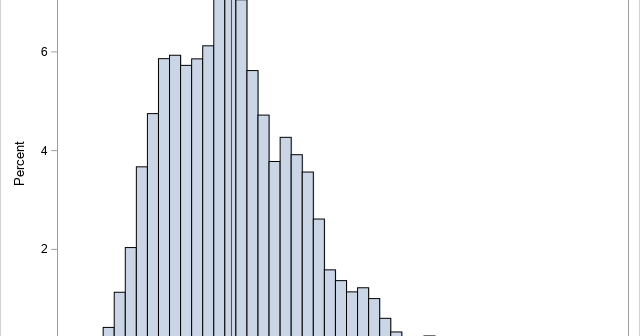
If you perform a weighted statistical analysis, it can be useful to produce a statistical graph that also incorporates the weights. This article shows how to construct and interpret a weighted histogram in SAS. How to construct a weighted histogram Before constructing a weighted histogram, let's review the construction of
How can you specify weights for a statistical analysis? Hmmm, that's a "weighty" question! Many people on discussion forums ask "What is a weight variable?" and "How do you choose a weight for each observation?" This article gives a brief overview of weight variables in statistics and includes examples of
In a large simulation study, it can be convenient to have a "control file" that contains the parameters for the study. My recent article about how to simulate multivariate normal clusters demonstrates a simple example of this technique. The simulation in that article uses an input data set that contains
My article about Fisher's transformation of the Pearson correlation contained a simulation. The simulation uses the RANDNORMAL function in SAS/IML software to simulate multivariate normal data. If you are a SAS programmer who does not have access to SAS/IML software, you can use the SIMNORMAL procedure in SAS/STAT software to
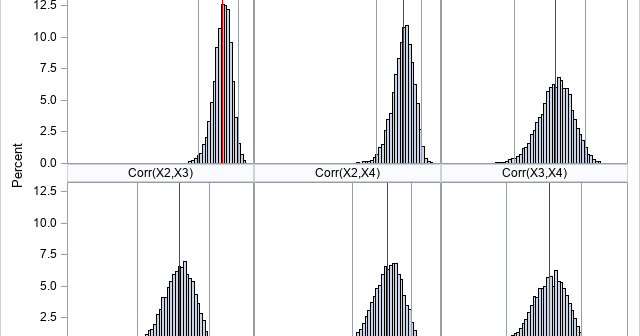
Pearson's correlation measures the linear association between two variables. Because the correlation is bounded between [-1, 1], the sampling distribution for highly correlated variables is highly skewed. Even for bivariate normal data, the skewness makes it challenging to estimate confidence intervals for the correlation, to run one-sample hypothesis tests ("Is
Toe bone connected to the foot bone, Foot bone connected to the leg bone, Leg bone connected to the knee bone,... — American Spiritual, "Dem Bones" Last week I read an interesting article on Robert Kosara's data visualization blog. Kosara connected the geographic centers of the US zip codes in